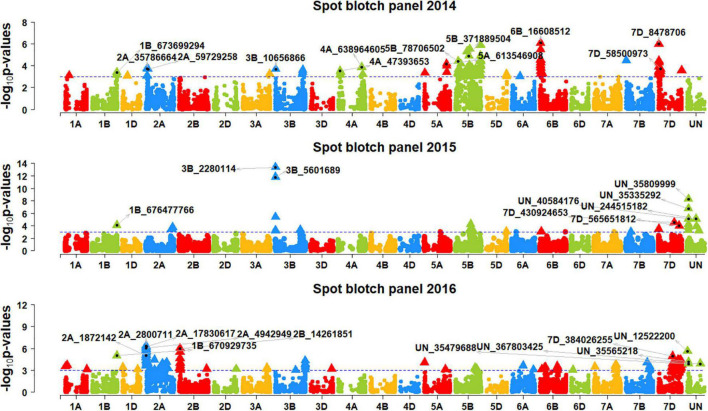
FIGURE 2.
Manhattan plots showing the marker –log10 p-values and chromosomal positions obtained from genome-wide association mapping for spot blotch in panels 2014, 2015 and 2016. The blue line indicates the p-value threshold of 0.001 and selected markers that were either very significantly associated with spot blotch or associated in more than one panel are indicated.

