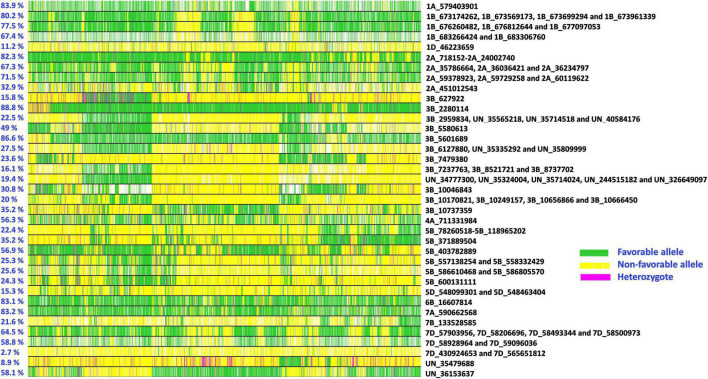
FIGURE 5.
Allelic fingerprinting of spot blotch associated markers. The percentage values on the left indicate the percentage of lines with favorable alleles at the markers. The green color indicates the favorable allele (allele that has a decreasing effect on spot blotch), the yellow color indicates the non-favorable allele (allele that has an increasing effect on spot blotch), the magenta color indicates the heterozygote, and the white color indicates missing data.

