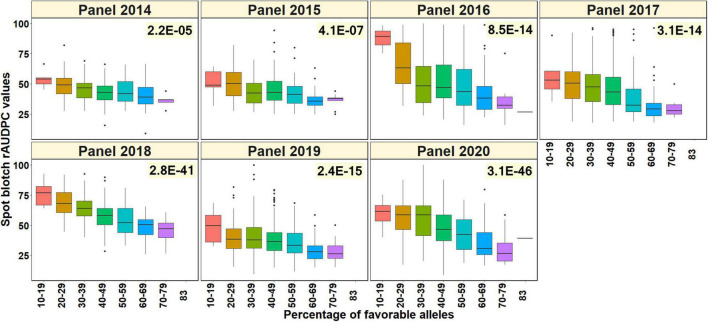
FIGURE 6.
Percentage of favorable alleles (alleles that have a decreasing effect on spot blotch) in the lines from different panels plotted against the spot blotch relative area under the disease progress curve (rAUDPC) values in seven panels. The values on the top right of the panels indicate the two-sided p-values for the test that there is no relationship between the percentage of favorable alleles and the spot blotch rAUDPC values of the lines against the alternate hypothesis that there is a relationship.

