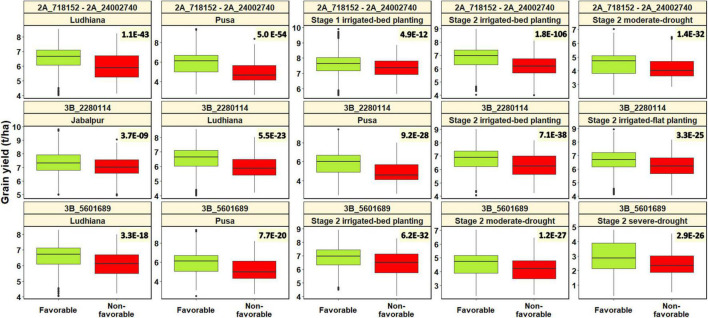
FIGURE 7.
Spot blotch favorable alleles (alleles that have a decreasing effect on spot blotch) and non-favorable alleles (alleles that have an increasing effect on spot blotch) at linkage disequilibrium block 2A_718152 – 2A_24002740 and markers 3B_2280114 and 3B_5601689 plotted against the grain yield in different environments. The values on the top right of the panels indicate the two-sided t-test p-values for the test that there is no relationship between the spot blotch associated marker alleles and grain yield against the alternate hypothesis that there is a relationship.

