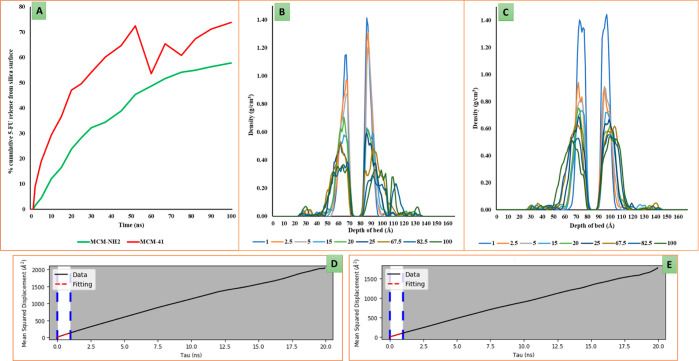
Figure 12.
(A) Release rate of 5-FU from the MCM bed in presence of water where the green and red curve represents the % release of 5-FU molecules from MCM-NH2 and MCM-41, respectively; the density profile of 5-FU on (B) MCM-41 and (C) MCM-NH2 where the X-axis represents the depth of the bed in Å, and the Y-axis represents the density of 5-FU molecules. The different colored lines shown in the legend represent the density of the 5-FU molecules at different time intervals of MD simulations viz.,, 1, 2.5, 5, 15, 20, 25, 67.5, 82.5, and 100 ns. (D,E) Diffusion coefficient of the 5-FU molecules from the MCM-41 and MCM-NH2 surface over the simulation time period of 20 ns.

