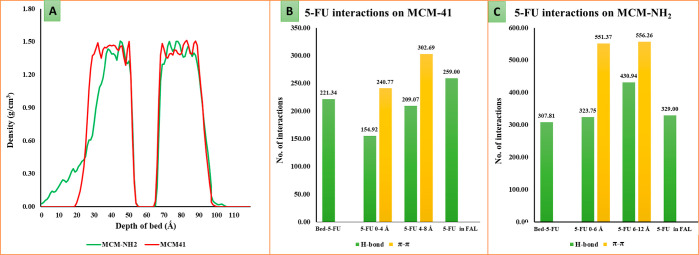
Figure 9.
(A) depicts the density profile for 5-FU adsorbed on the MCM-41 and MCM-NH2 surface where the green and red curve represents 5-FU adsorbed on MCM-NH2 and MCM-41, respectively. The X-axis represents distance in Å units from the top side of the simulation box moving through the silica bed and the opposite side of the surface. The Y-axis represents the density of the 5-FU molecules on the generated silica bed. (B,C) are the number of H-bond counts between 5-FU in the first and second adsorption layer and between the 5-FU and surface of MCM-41 and MCM-NH2, respectively, counted in the structures saved in the trajectory from MD simulations (5-FU- 5-FU, bed—MCM surface, FAL-first adsorption layer, H-bond- hydrogen bond, and π–π -pi-pi stacking).

