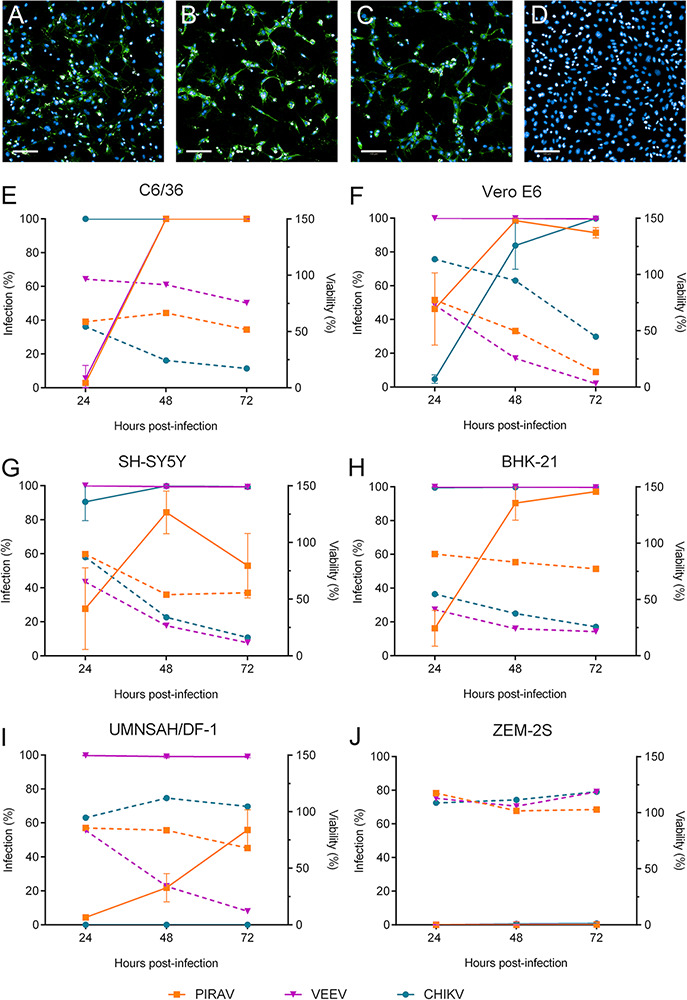
Figure 5.

PIRAV infects different cell lines. Immunofluorescence images show the SH-SY5Y cell line 24 h after infection with Pirahy (A), VEEV (B), or CHIKV (C) at an MOI of 1.0 or left uninfected (D). Alphavirus E1 protein is shown in green. Scale bar = 100 µm. Graphs show the time course of PIRAV replication in different cell lineages. Percentages of infection (solid lines) and cell viability (dashed lines) from 24 to 72 h.p.i. are shown for C6/36 (E), Vero E6 (F), SH-SY5Y (G), BHK-21 (H), UMNSAH/DF-1 (I), and ZEM-S2 (J) lineages. Infection was performed at an MOI of 0.1, and results are presented as the mean of duplicate infection (E and J) or as the means from triplicate experiments (F–I). Bars represent the means ± SD.
