
Appendix Exhibit 4.
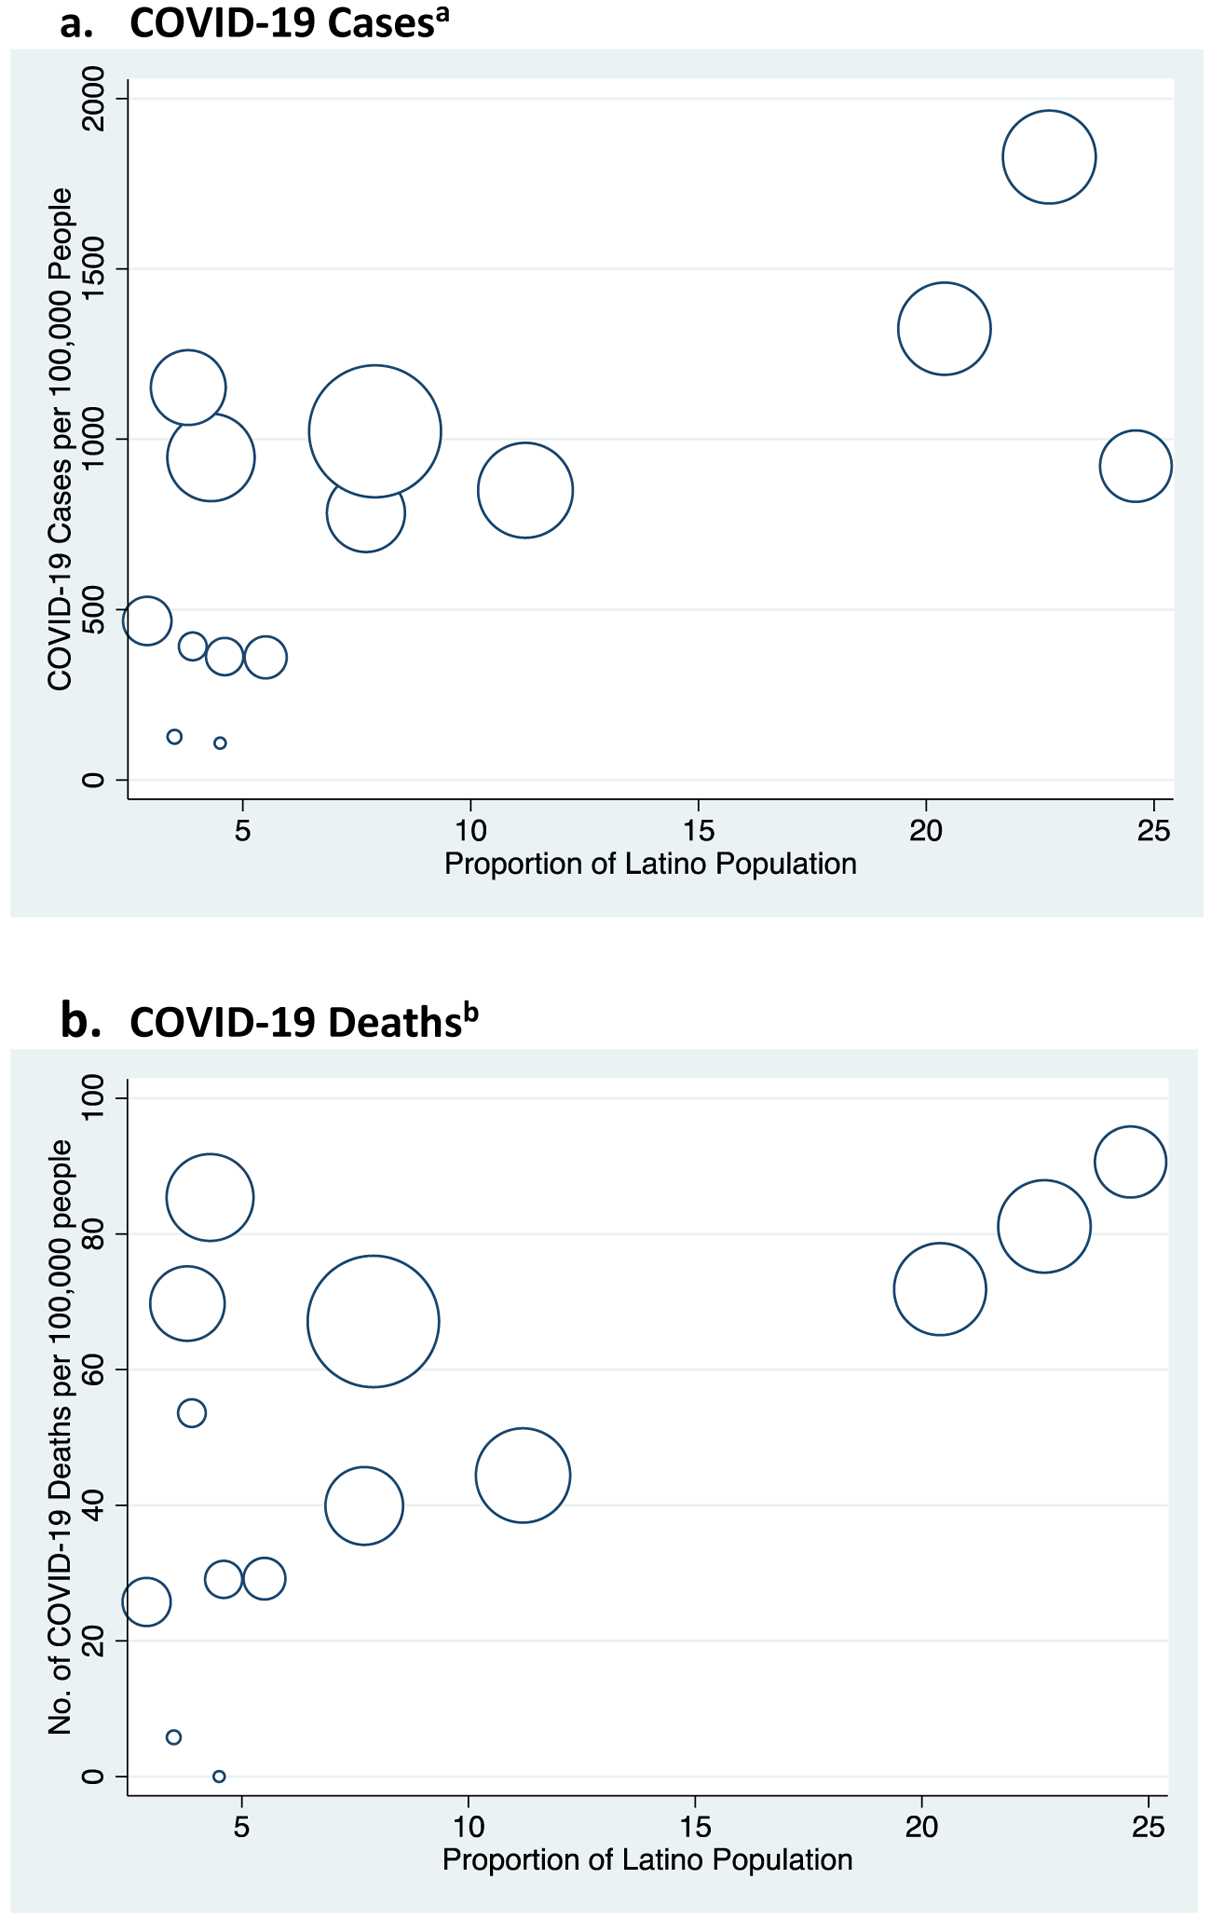
Proportion Latino Population and Number of COVID-19 Cases and Deaths per 100,000 Population Across Massachusetts Counties
Source: Authors’ analyses of Massachusetts Department of Public Health Data 2020 and American Community Survey
Notes: Counties include: Barnstable, Berkshire, Bristol, Dukes, Essex, Franklin, Hampden, Hampshire, Middlesex, Nantucket, Norfolk, Plymouth, Suffolk, Worchester. Size of data points correspond to the relative county population sizes.
Data from January 1st to May 6th, 2020 from Massachusetts Department of Public Health.
a Pearson Correlation Coefficient, 0.69 (p-value=0.006)
b Pearson Correlation Coefficient, 0.61 (p-value=0.020)