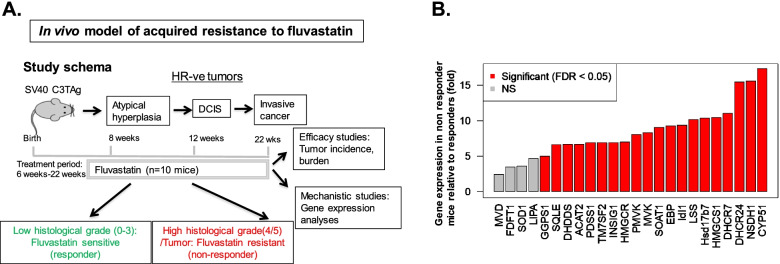
Fig. 3.
Steroid- and terpenoid backbone- biosynthesis pathway genes associate with fluvastatin resistance in a transgenic mouse model of breast cancer. A Schematic showing SV40C3 TAg mice treatment group, drug dosing and timeline. Fluvastatin treatment (10 mg/kg/d) was started at about 6 weeks of age and continued till 22 weeks of age through their drinking water. At the end of study, mice were sacrificed, and their mammary glands were collected and processed for RNA extraction, qPCR and histological processing. B Bar diagrams show qPCR validation where over expression of genes (that are part of an inherent and acquired resistance signature panel) correlates tumor outcome in fluvastatin treated SV40C3TAg mice. The Y axis depicts the fold changes of average gene expression that was calculated by using the ΔΔCt method (as described previously [14] after normalizing with ribosomal protein L19. Red color in bar diagram represents the fold changes were significant and gray represents non-significant (NS) changes at an FDR of < 5%

