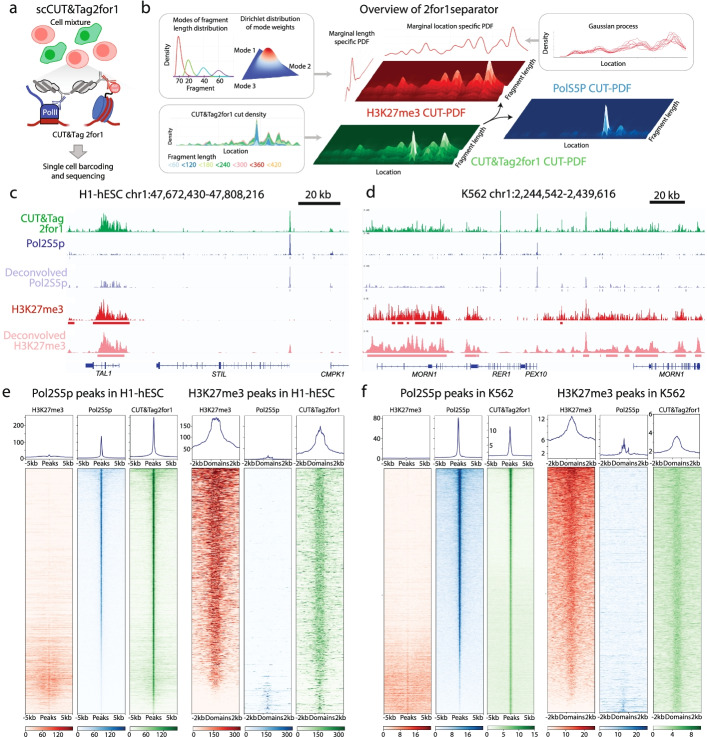
Fig. 3.
Deconvolution of CUT&Tag2for1 using fragment length, cut-site density and feature width. a Schematic of the single-cell CUT&Tag2for1 experimental rationale, in which two cell types are profiled in bulk in parallel and then arrayed on an ICELL8 microfluidic chip for cell-specific barcoding via amplification and mixing before sequencing. b Schematic of the deconvolution approach using a Bayesian model by considering differences in fragment length distributions, feature widths of the two targets and cut-site probability density function (PDF). c Genome browser screenshot showing a CUT&Tag2for1 profile (green) in comparison with H3K27me3 CUT&Tag (red) and Pol2S5p-CUTAC (blue) for a representative region in H1 human embryonic stem cells (hESC), along with inferred peaks from single-cell CUT&Tag2for1 data. d Same as c for K562 cells. e, f Single antibody and CUT&Tag2for1 data at the inferred Pol2S5p (left) and H3K27me3 peaks (right) for H1 and K562 cells, where misclassified peak numbers and percentages are H1 Pol2S5p (1261 = 8.2%), H1 H3K27me3 (161 = 11.0%), K562 Pol2S5p (396 = 1.0%), and K562 H3K27me3 (496 = 3.7%). In c–f, CUT&Tag2for1 data represent the pseudo-bulk aggregate for all cells derived by pooling single-cell data, and Pol2S5p and H3K27me3 data are from single antibody data. Results were obtained by pooling cells from two single-cell replicates

