FIGURE 2.

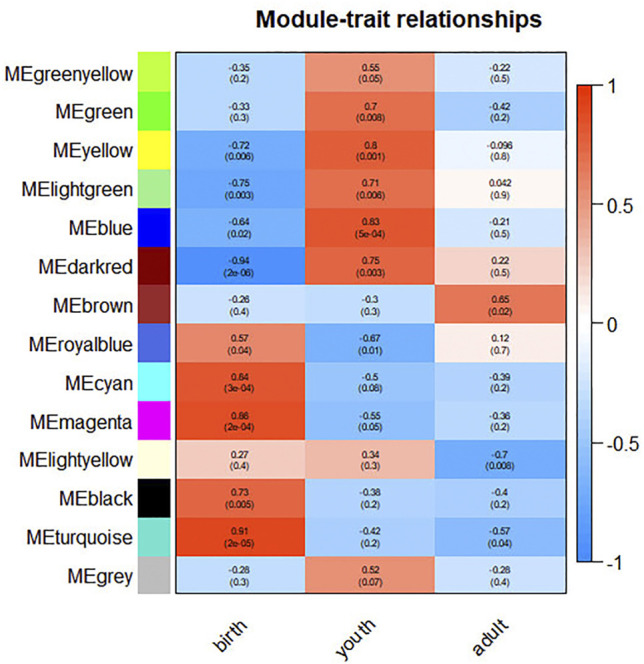
Correlation between modules and differentiation period. The color, ranging from blue through white to red, indicates negative to positive correlation.

Correlation between modules and differentiation period. The color, ranging from blue through white to red, indicates negative to positive correlation.