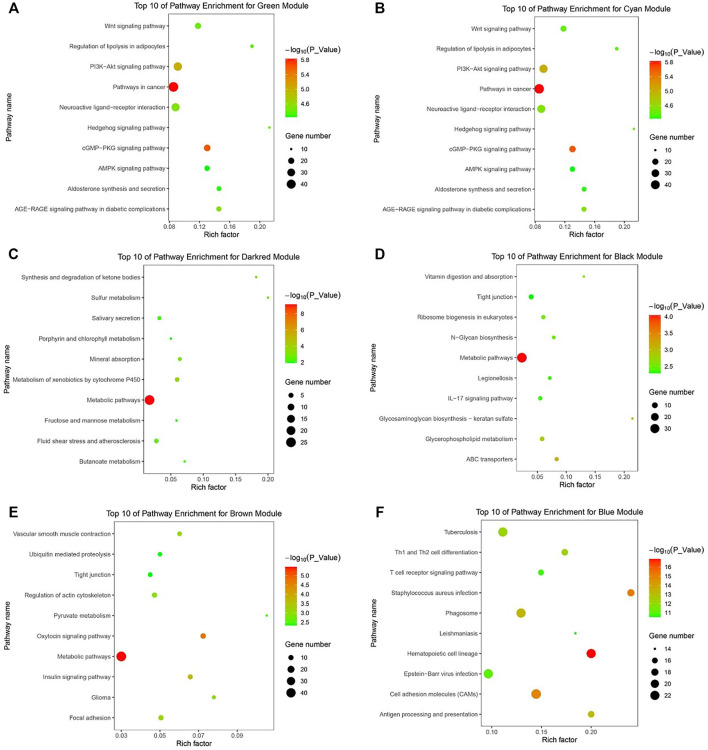
FIGURE 4.
KEGG pathway analysis of related DEGs. (A) The top 10 of pathway enrichment for green module. (B) The top 10 of pathway enrichment for cyan module. (C) The top 10 of pathway enrichment for darkred module. (D) The top 10 of pathway enrichment for black module. (E) The top 10 of pathway enrichment for brown module. (F) The top 10 of pathway enrichment for blue module.

