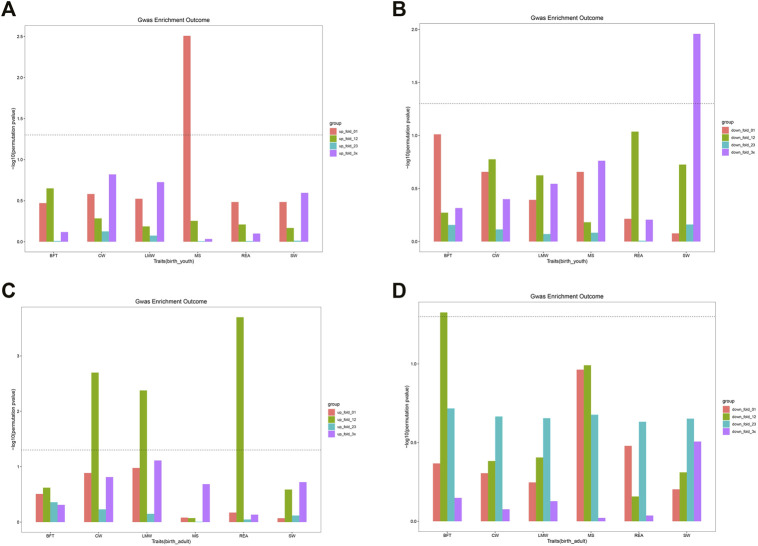
FIGURE 5.
The GWAS enrichment for DEGs in different groups. (A) The enrichment for DEGs of four groups in birth vs youth. (B) The enrichment for DEGs of four groups in birth vs youth. (C) The enrichment for DEGs of four groups in birth vs adult. (D) The enrichment for DEGs of four groups in birth vs adult. The line means P is equal to 0.05.

