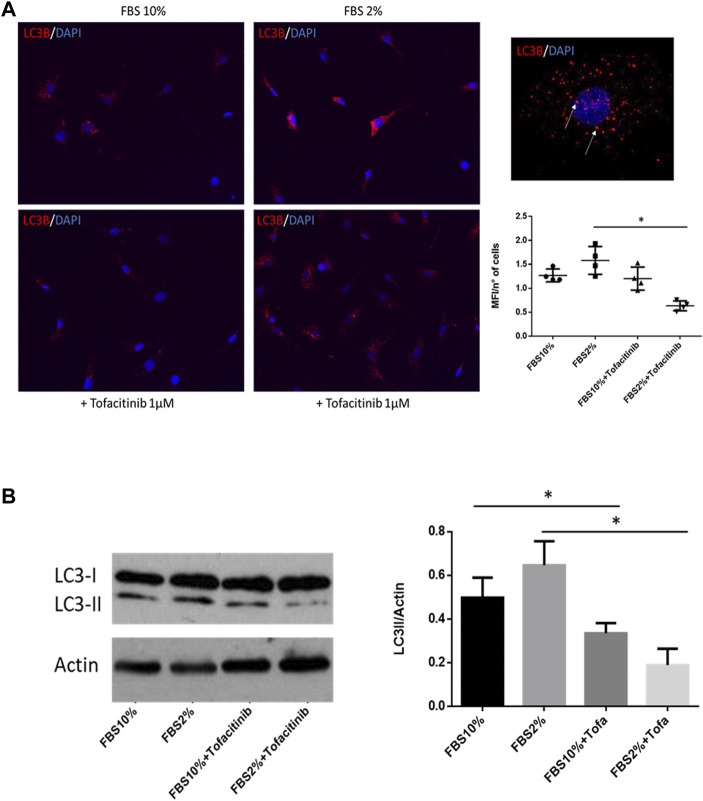
FIGURE 2.
Effect of tofacitinib on autophagy in FLS cultured in serum deprivation condition. (A) Immunocytofluorescence analysis of autophagy in FLS treated with tofacitinib alone and in starvation (FBS 2%). Autophagic LC3B + vesicles are stained in red in RA FLS treated with tofacitinib alone and in serum deprivation condition for 20 h (2% FBS). Cells were counterstained with DAPI dye to reveal DNA (blue staining). Autophagy is expressed as MFI normalized on the number of cells. The quantification was performed on four different areas for each condition. Images are representative of five independent experiments and higher magnification (×40) picture is also showed. *p < 0.05. (B) Western blot analysis of autophagy levels in FLS cultured in the presence of tofacitinib. Starvation was used to induce autophagy (FBS 2% for 20 h), and tofacitinib was used as a treatment for 20 h (1 µM). Autophagy was quantified by densitometric analysis on LC3-II and then normalized on β-Actin. Data are referred to five independent experiments in cells from different RA patients. *p < 0.05.

