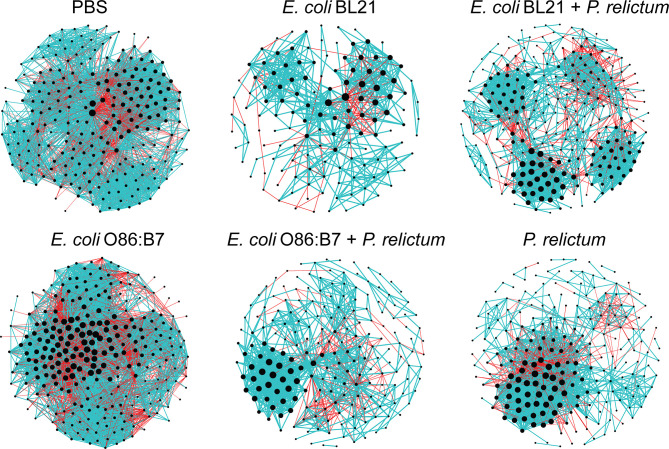
Figure 6.
Co-occurrence networks of C. quinquefasciatus microbiota in the different experimental groups. Bacterial co-occurrence networks were inferred from the microbiota of mosquitoes fed on control (PBS), vaccinated and/or infected birds. Nodes represent bacterial taxa and connecting edges stand for a co-occurrence correlation (SparCC > 0.75). Node sizes are proportional to the eigenvector centrality value. Edges representing positive or negative correlations were colored in blue and red, respectively. Only nodes with at least one connection are displayed.

