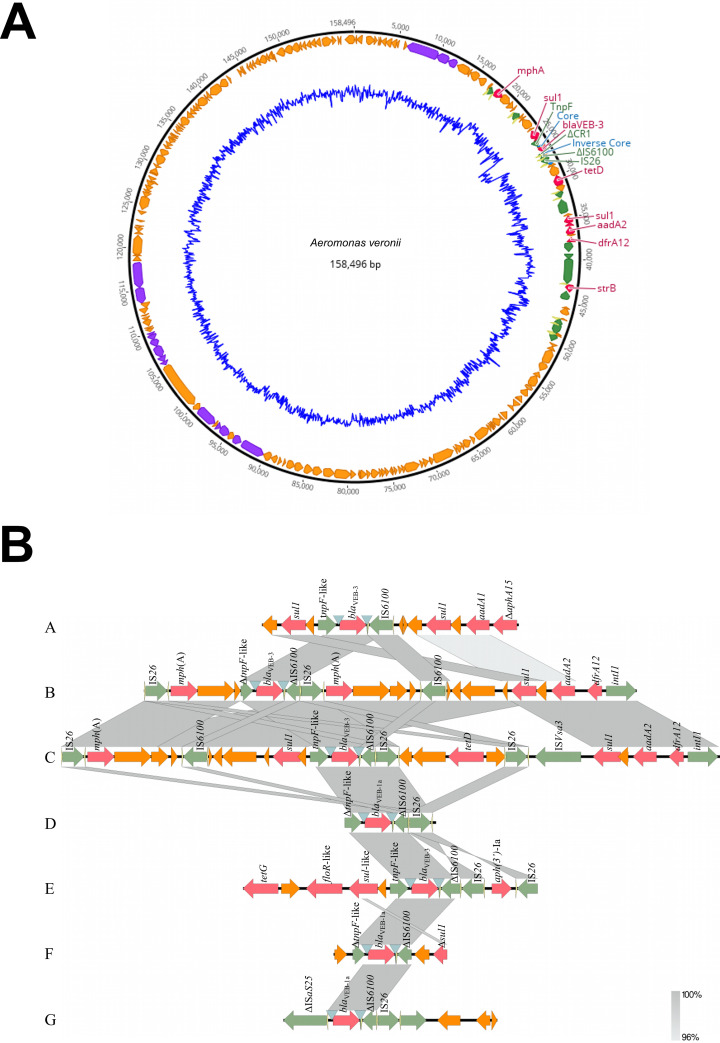
FIG 1.
(A) Genetic map of p158496, displayed in the outermost ring. Open reading frames are represented by arrows in the direction of transcription; they are color coded according to their putative functions, as follows: purple, conjugation machinery; red, ARGs; green, MGEs; yellow, inverted repeats; orange, all other coding sequences. The inner blue ring displays the GC content of the plasmid. Genes of interest are labeled. This figure was created using Geneious v11.1.5. (B) Schematic representation of isolates from the NCBI GenBank database containing the blaVEB gene with regions homologous to those found in p158496. Open reading frames are represented by arrows in the direction of transcription; they are color coded according to their putative functions, as follows: red, ARGs; green, MGEs; yellow, inverted repeats; orange, all other coding sequences. Inverted blue triangles represent the recombination core and inverse core sites. The identity between adjacent sequences is shown as gray shading. Δ indicates the truncation of a gene. Descriptions of isolates A through G are presented in Table 1. This figure was created using EasyFig.

