Figure 6.
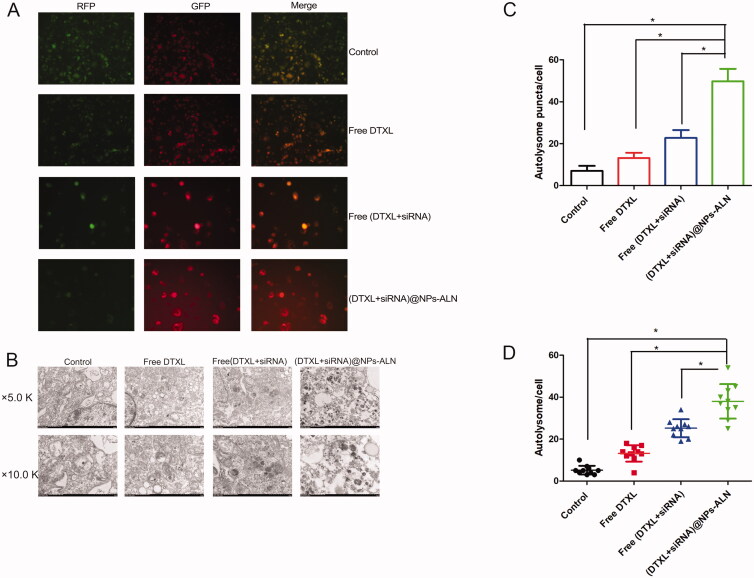
PC-3 cell autophagy analysis after treated with nanoparticles. (A) Fluorescence image indicated the most autolysosome was in the (DTXL + siRNA)@NPs group, while the autophagosomes did not increase significantly. (B) Electron microscopy indicated the most autolysosome and autophagosomes appeared in the (DTXL + siRNA)@NPs-ALN group. (C) Statistics analysis was performed to analyze the number of autolysosome in the cell of different groups, which was observed with fluorescence microscopy; (D) Statistics analysis was performed to analyze the number of autolysosome in the cell of different groups, which was observed with electron microscopy. Data were expressed as the mean ± SD (n = 3). *p < 0.05.

