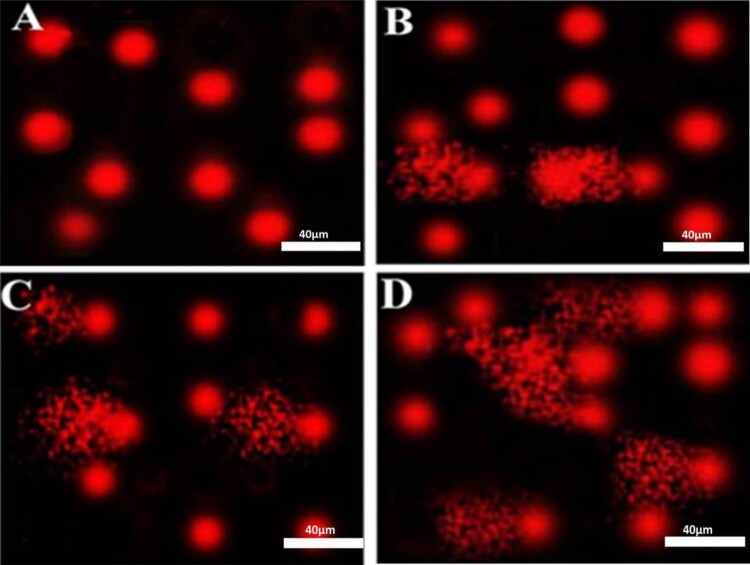
Figure 1.
Photomicrographs representation of DNA damage in peripheral blood mononuclear cells using comet assay in control group (A), diabetic group without retinopathy (B), nonproliferative diabetic retinopathy group (C), proliferative diabetic retinopathy group (D). (The scale bar is 40 µm, 5 fields were assessed to provide this representative image).

