Figure 2.

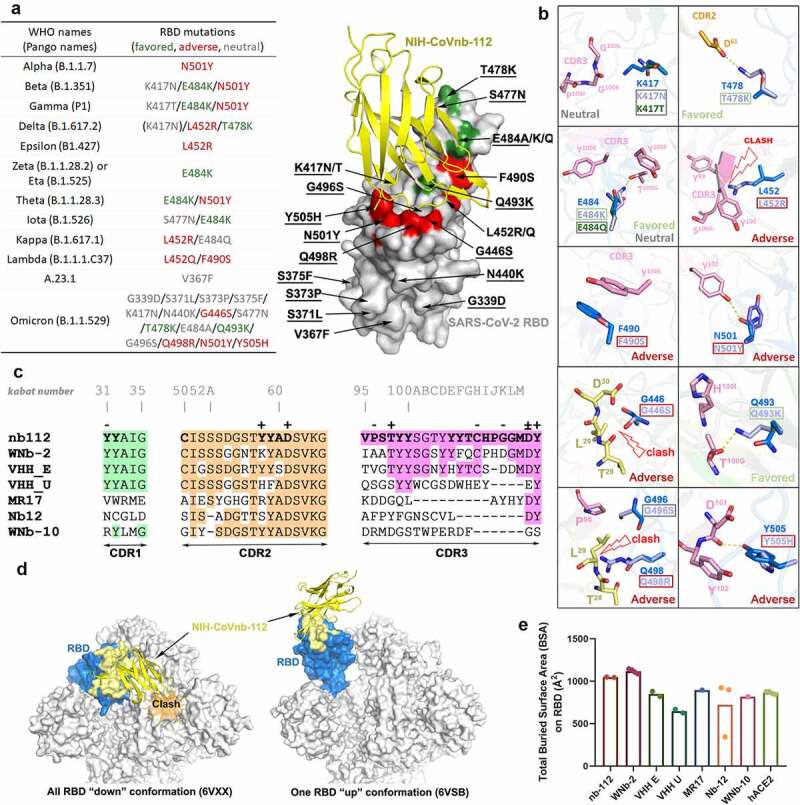
Crystal structure of NIH-CoVnb-112 in complex with SARS-CoV-2 RBD and effects of RBD mutations. (a) Diagram of RBD mutations within the circulating SARS-CoV-2 variants of concern. Mutations which are structurally predicted to promote, impair or have no discernible effect on NIH-CoVnb-112 binding are colored in green, red and gray, respectively. Mutations identified in the Omicron variant are underlined in the right structural diagram. (b) Composite model of RBD mutations in proximity to the epitope of NIH-CoVnb-112 with nanobody and prototype RBD colored as in Figure 1. RBD mutations in VOCs which could potentially disrupt the original interactions or impose steric hindrance to the nanobody-RBD interface are labeled as “adverse” (marked with dark-red boxes), those which may introduce additional contacts are labeled as “favored” (green boxes), and those which are predicted to have no effect are labeled as “neutral” (gray boxes). (c) CDRs Sequence alignments of NIH-CoVnb-112 with six structurally characterized RBD-binding nanobodies. The identical amino acids as compared to NIH-CoVnb-112 are shaded in colors as indicated in Figure 1a. The interface residues (BSA > 0 Å) as calculated by PISA are highlighted in bold. Residues involved in salt-bridges or H-bonds to the RBD are marked above the sequence with (+) for the side chain, (-) for the main chain and (±) for both. The Kabat19 scheme was used to number nanobody amino acid residues, with unique insertion residues indicated by letter. (d) RBD-based superimposition of the NIH-CoVnb-112-RBD complexes with SARS-CoV-2 spike in a closed (PDB: 6VXX)20 or one-RBD-up state (PDB: 6VSB).21 The nanobody is shown as yellow ribbons and the RBD domain is colored in blue with the nanobody epitope highlighted in yellow. The potential clashes of nanobody with the adjacent RBD of the closed spike trimer is shown in the left panel. (e) Comparisons between the RBD total buried surface areas (BSAs) of NIH-CoVnb-112, ACE2 and six published RBD-directed nanobodies. Plot of the individual BSA values, with the mean value represented by bar graph, of the equivalent copies presented in the asymmetric unit.
