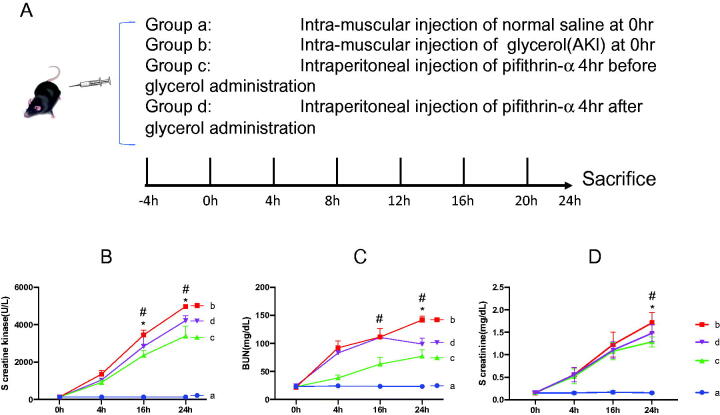
Figure 2.
Serum creatine kinase and renal function parameters in glycerol and pifithrin-α treated mice. (A) Grouping of the mice. In each group, the number of mice was no less than five. (B) Serum creatine kinase at every checkpoint in each group was determined and compared, respectively. (C and D) Serum BUN and creatinine levels at every checkpoint in each group were determined and compared, respectively. *p < 0.05 when Group C compared with Group D; #p < 0.001 when Group C compared with Group B.

