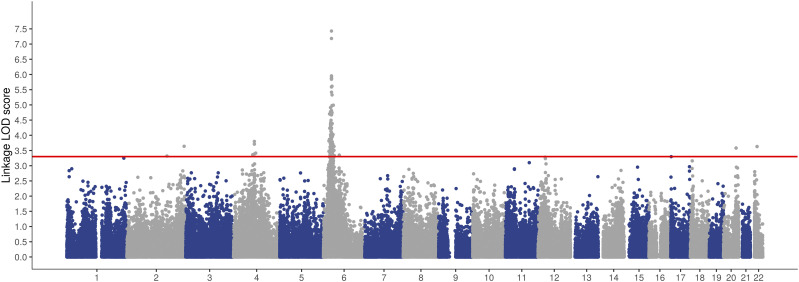
Figure 1.
Manhattan plot of genome-wide linkage analysis. Plot shows results of genome-wide linkage analysis LOD scores. Analysis showed linkage peaks with genome-wide significant LOD scores >3.3 on chromosomes 2q24.3, 2q37.2, 4q21–22, 4q25, 6p21–22, 20q13.2, and 22q12.1. The highest and widest peak occurs on chromosome 6p HLA region.

