
FIGURE 1.
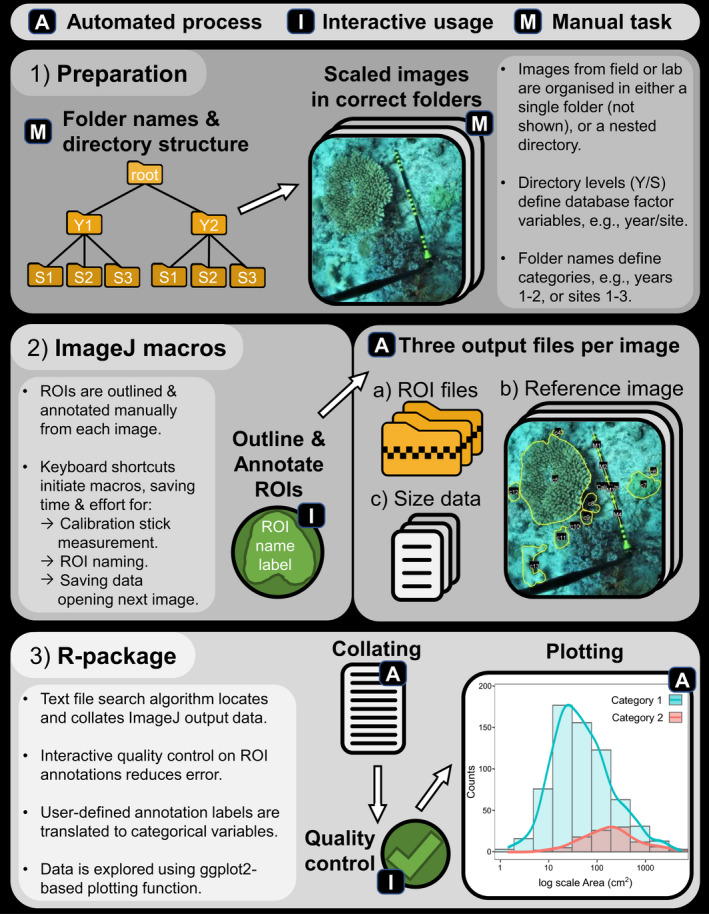
Conceptual diagram of the SizeExtractR workflow, highlighting the automated (A), interactive (I, green), and manual (M) steps. (1) Preparation: Images from field or laboratory work that each include a scale of known length (e.g., 10cm banded stick), are either put in a single folder (not shown) or organized among multiple folders with a nested directory structure that will later define optional categorical database variables (e.g., Year subfolders [categories: 1, 2], within Site subfolders [categories: 1, 2, 3], within a root folder). (2) ImageJ macros: The images are annotated using SizeExtractR‐macros and default ImageJ tools (e.g., freehand tool) to outline all regions of Interest (ROIs) and label them according to a user‐defined labeling system (e.g., to record user‐defined categorical variables, see Figure 2). Three output files are produced per image: a text file containing uncalibrated ROI size measurements and alphanumeric ROI annotations; a zip folder containing ROI files; and a reference image showing all ROI outlines and annotations. (3) R‐package: SizeExtractR‐package is then used to (a) conduct quality control and check ROI annotations; (b) calibrate size measurements, extract user‐defined categorical variables from folder names and ROI annotation labels and collate all data; and (c) plot size frequency distributions among categorical grouping variables