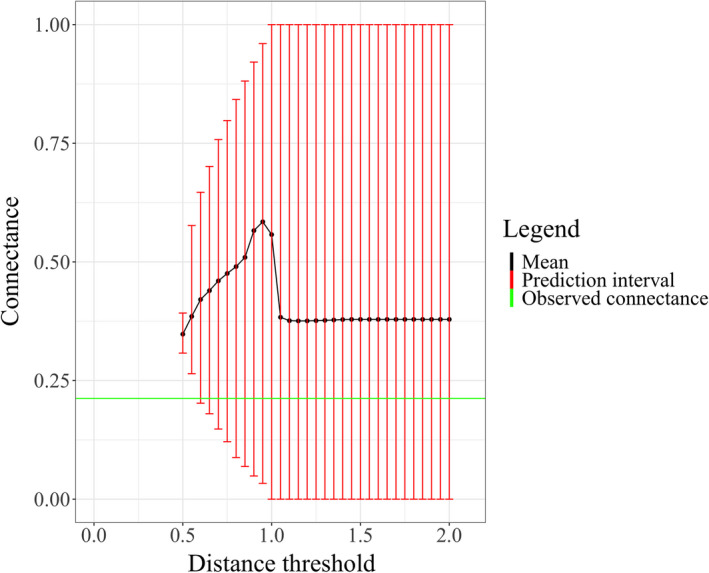
FIGURE 2.

The prediction interval of the predicted connectance increases with increasing distance threshold for the Benguela Pelagic food web. The green line and black line represent the observed connectance and mean of predicted connectance, respectively
