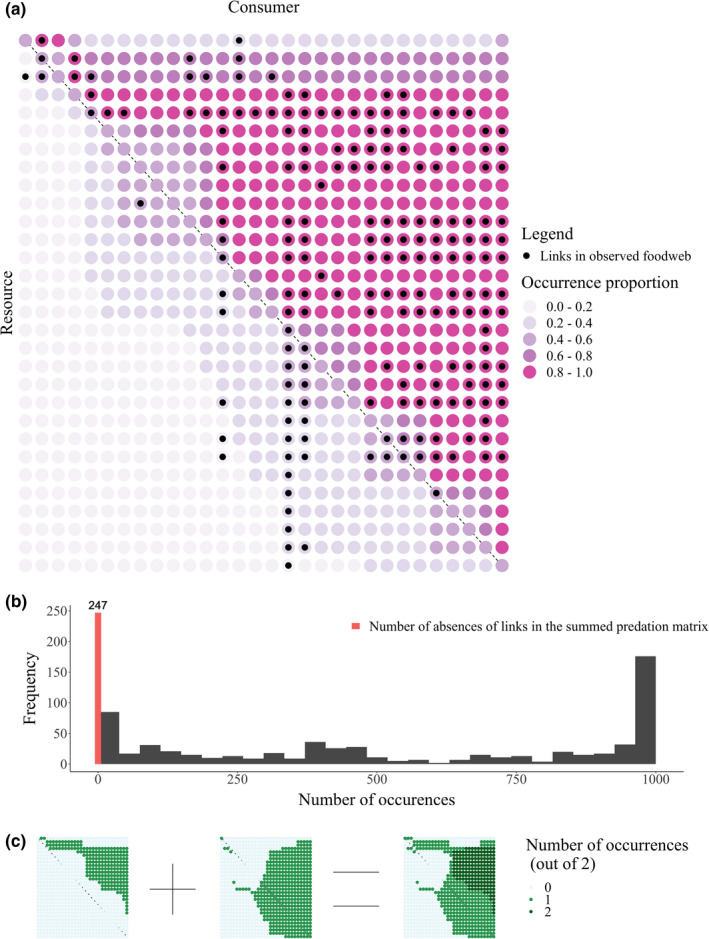
FIGURE 3.

(a) Observed and predicted predation matrices for Benguela Pelagic food web. Body size increases from left to right and top to bottom along the predation matrix. Black circles show where there is an observed trophic link. The intensity of the pink circles shows the proportion of 1000 predicted food webs that had a trophic link between the corresponding species. This type of overlay is shown for two examples predicted in panel (c). (b) The histogram of the number of times a link was predicted across 1000 independently predicted food webs. There were 841 species pairs in this food web. About 150 of these were predicted to have a trophic link in all 1000 predicted predation matrices. The red bar shows the number of pairs of species for which a trophic link was never predicted. (c) Two predicted predation matrices for Benguela Pelagic food web corresponding to the minimum and the maximum value of estimated , and their sum
