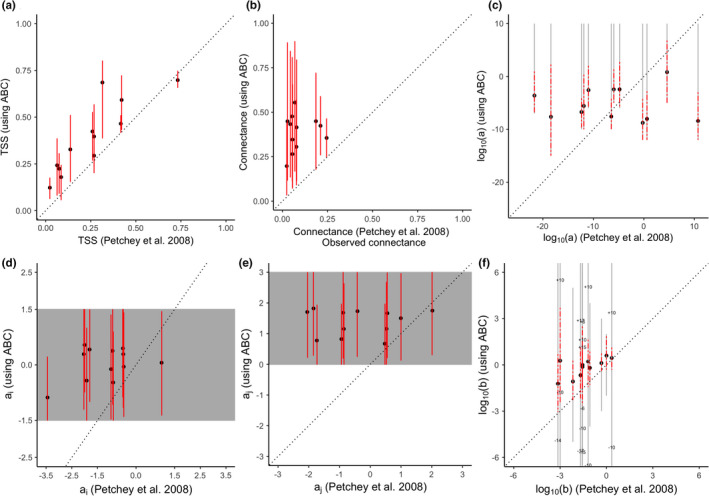
FIGURE 5.

TSS (a), connectance (b) and ADBM parameters (c, d, e, f) computed using the ABC method compared with the corresponding point estimates from Petchey et al. (2008). The red lines are the 95% credible/prediction intervals and the black filled circles represent the corresponding means. The gray region represents the intervals of the prior distributions for and . The gray lines represent the prior range of the parameters and in the scale. The prior range for the parameter extends above and below the y‐axis limits for some food webs and so the values of the limits are shown on the plot. The dashed black lines are the 1:1 relationships for reference
