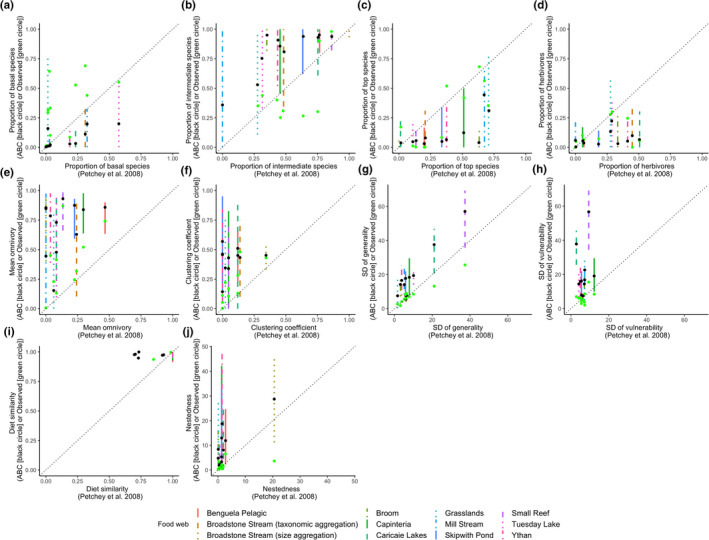
FIGURE 6.

Structural properties of predicted food webs with 95% prediction interval parameterized using the ABC method plotted against the point estimates from Petchey et al. (2008). The black filled circles correspond to the mean, and green filled circles correspond to the properties of the observed food webs. The dashed black lines are the 1:1 relationships for reference
