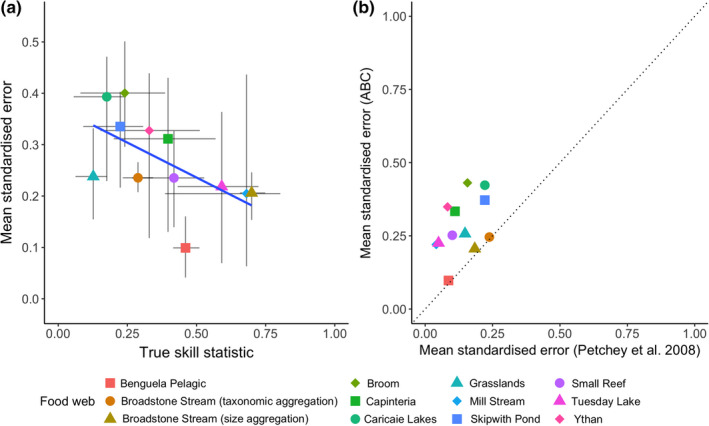
FIGURE 7.

(a) The mean standardized error of the food web properties predicted from the ADBM parameterized using rejection ABC plotted against the mean TSS for each food webs. The vertical and horizontal bars correspond to 95% prediction intervals of the standardized error and TSS, respectively. Solid blue line is linear regression through the means (t = −2.335, df = 10, p = .041). (b) The mean standardized error computed from the ABC method plotted against the mean standardized error from Petchey et al. (2008). The dashed line is the 1:1 relationship for reference
