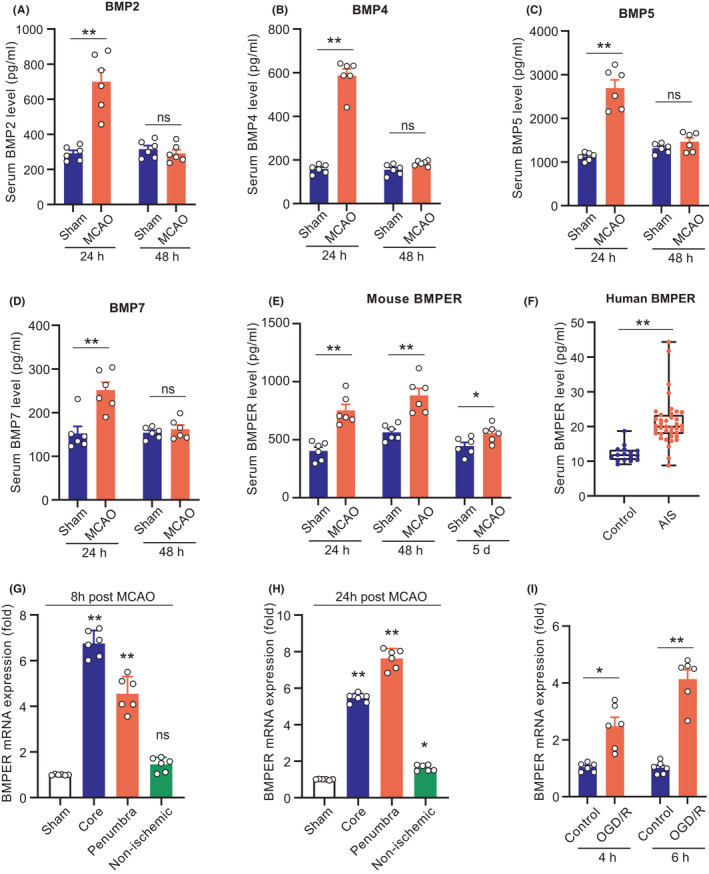
FIGURE 1.

Serum BMPER is induced upon cerebral ischemia in mouse and human. (A–E) Serum levels of BMP2, BMP4, BMP5, BMP7, and BMPER at 24 and 48 h post‐MCAO. Data are expressed as mean ± SEM, n = 6, *p < 0.05, **p < 0.01 by Student's t‐test. (F) Serum BMPER levels in 39 AIS patients and 16 healthy volunteers. The blood was drawn within 6 h from the onset of the brain ischemia symptoms and before thrombolytic therapy. Data are expressed as median (Q1–Q3, range), **p < 0.01 by Mann–Whitney U‐test. (G, H) The mRNA expression of BMPER in ischemic core, penumbra, and non‐ischemic area in MCAO mice and sham‐operated mice. Data are expressed as mean ± SEM, n = 6, *p < 0.05, **p < 0.01 versus Sham by ANOVA followed by LSD‐t post hoc test. (I) The mRNA expression of BMPER in primary cultured neurons under OGD/R stress for 4 and 6 h. Data are expressed as mean ± SEM, n = 6, **p < 0.01 by Student's t‐test. AIS, acute ischemic stroke; BMP, bone morphogenetic protein; BMPER, BMP‐binding endothelial regulator; MCAO, middle cerebral artery occlusion; OGD/R, oxygen‐glucose deprivation/reperfusion
