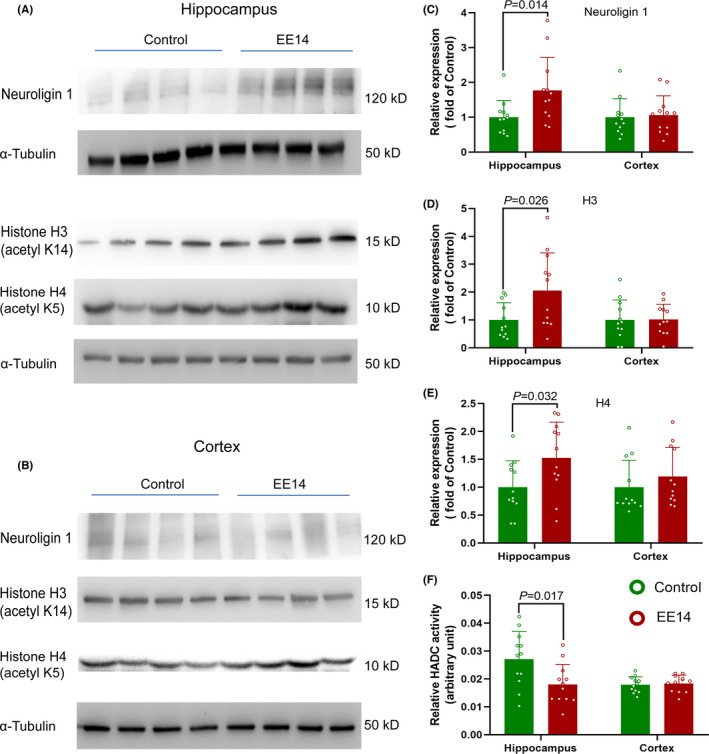
FIGURE 3.

EE increased neuroligin 1 in the hippocampus. Mice had EE or SE for 14 days. Their hippocampus and cerebral cortex were harvested 24 h after the completion of EE. (A) Representative images of western blotting of hippocampal samples. (B) Representative images of western blotting of cerebral cortical samples. (C) Quantitative data of neuroligin 1. (D) Quantitative data of acetylated histone H3. (E) Quantitative data of acetylated histone H4. (F) HDAC activity. Results are mean ± S.D. (n = 12) with the presence of individual animal data in the bar graphs. Results were analyzed by t‐test. EE14: EE for 14 days
