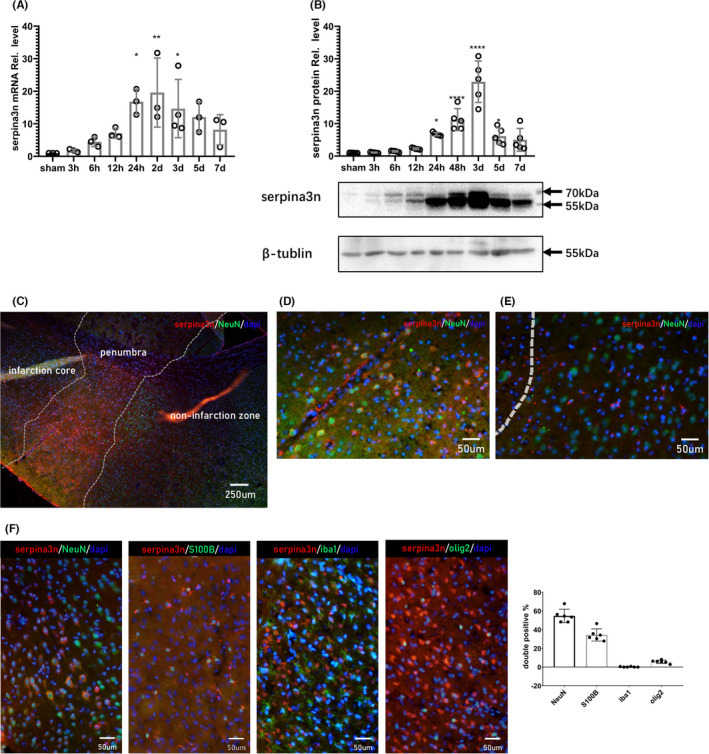
FIGURE 1.

Temporospatial distribution patterns of serpinA3N after MCAO. (A) qPCR assay and (B) Western blot analysis of serpinA3N expression at indicated time points after MCAO in mice. N = 3. *, **, ***, and **** p < 0.05, 0.01, 0.001, and 0.0001. (C–F) Immunostaining of serpinA3N with cell markers (C–E) NeuN, (F) S100b, Iba1, and Olig2 24 h after t‐MCAO, with percentage of double positive cells in total serpinA3N+ cells. Scale bar = 250 μm (C) and 50 μm (D–F)
