Figure 3.
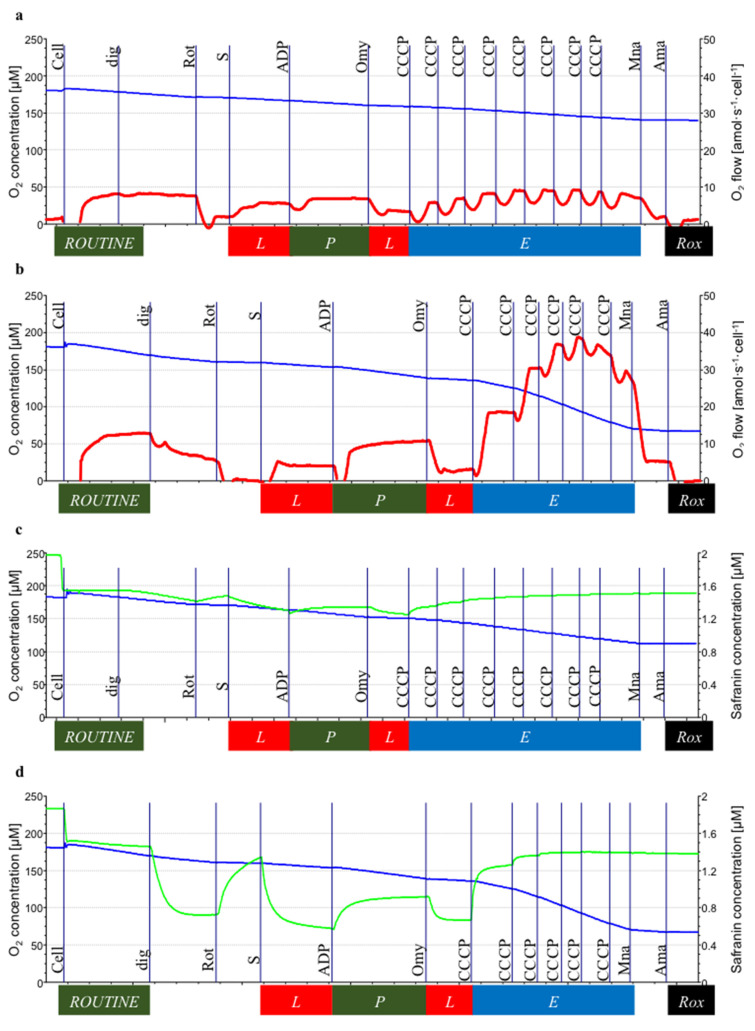
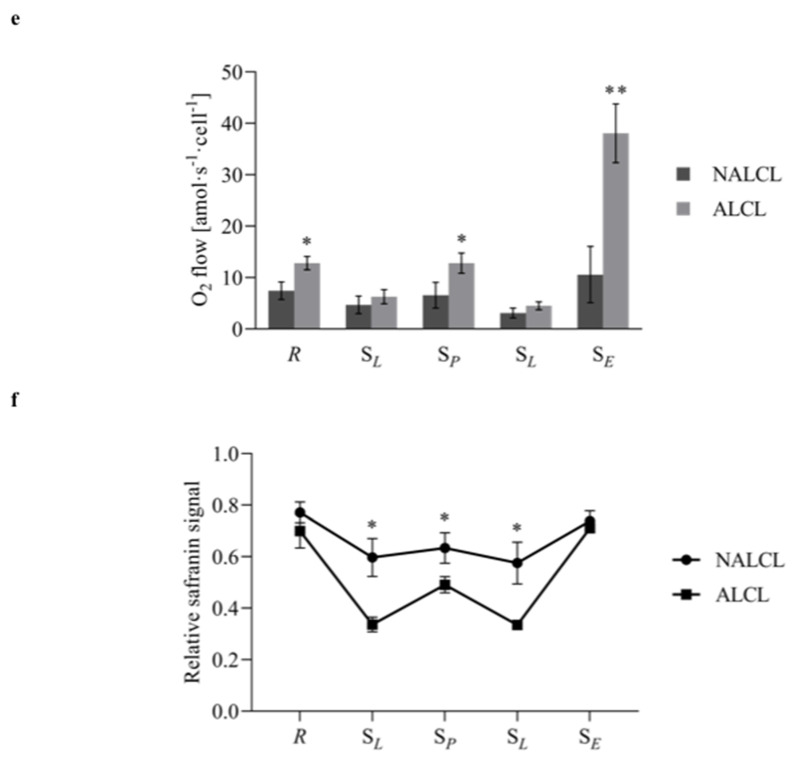
Succinate-linked respiration of NALCL and ALCL measured simultaneously with mitochondrial membrane potential in the presence of safranin. (a,b) are the protocols for measuring respiration in NALCL and ALCL, respectively, while (c,d) are the protocols for measuring mitochondrial membrane potential, mtMP using safranin concentration in NALCL and ALCL, respectively. Before the cells were added, safranin was calibrated up to 2 µM. The initial drop to 1.6 µM safranin is mainly due to unspecific binding upon the addition of cells. Low safranin concentrations indicate high mtMP. Titrations: Cell, dig (digitonin, cell permeabilization), Rot (rotenone, CI inhibition), S (succinate, S-LEAK respiration, SL(n)), ADP (S-OXPHOS capacity, SP), Omy (oligomycin, S-LEAK, SL(Omy)), CCCP (S-ET capacity, SE), Mna (malonate, CII inhibition), and Ama (antimycin A, CIII inhibition, Rox). Oxygen consumption was corrected for Rox. Blue plots indicate O2 concentration, red plots are the O2 consumption expressed per cell, and neon plots indicate safranin concentrations. (e) The Rox-corrected respiration and (f) the relative safranin signal: ROUTINE state, R, and in four respiratory states in permeabilized cells: S-linked LEAK respiration in the absence of adenylates, SL(n), S-linked OXPHOS capacity, SP, S-linked LEAK respiration after inhibition of ATP synthase by oligomycin, SL(Omy), and S-linked ET capacity, SE. Results are expressed as mean ± S.D. * denotes p < 0.05 while ** denotes p < 0.01 compared to NALCL as determined by Student’s t-test.


