Figure 3.
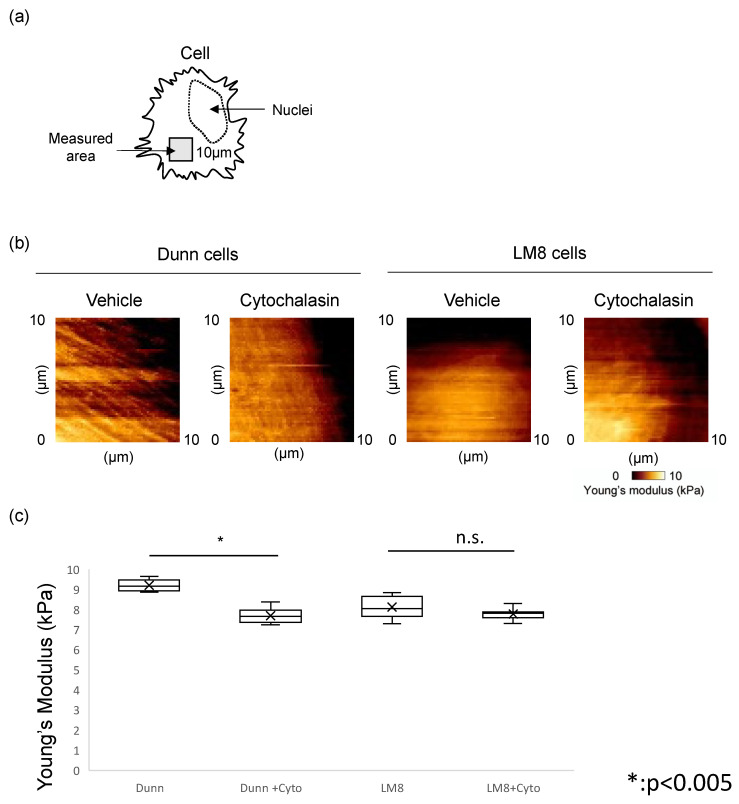
Change of Young’s modulus by cytochalasin. (a) Measured area by AFM was indicated in the scheme. (b) Young’s modulus images in Dunn (left) and LM8 (right) with or without cytochalasin were shown. (c) Young’s modulus was compared between Dunn and LM8 with or without cytochalasin. Dunn (−: 9.20 ± 0.27 kPa, +: 7.69 ± 0.35 kPa, p < 0.005), LM8 (−: 8.11 ± 0.51 kPa, +: 7.77 ± 0.26 kPa, * p < 0.005, n.s.: not significant).

