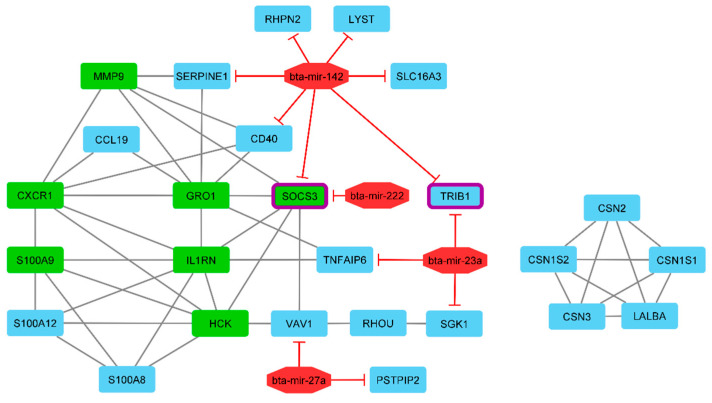
Figure 5.
Interactive bipartite network (gene–miRNA) which demonstrates the regulatory effect on mastitis in dairy cattle. In this network, the quadrilateral points represent genes, and the octagonal points represent miRNAs. Regarding miRNAs and target genes, the edges indicate the suppressive role of miRNAs. The edges also represent the gene–gene interactions. The green quadrilateral nodes represent the hub genes. The quadrilateral nodes that have purple around them are the genes showing the highest suppression by miRNAs.

