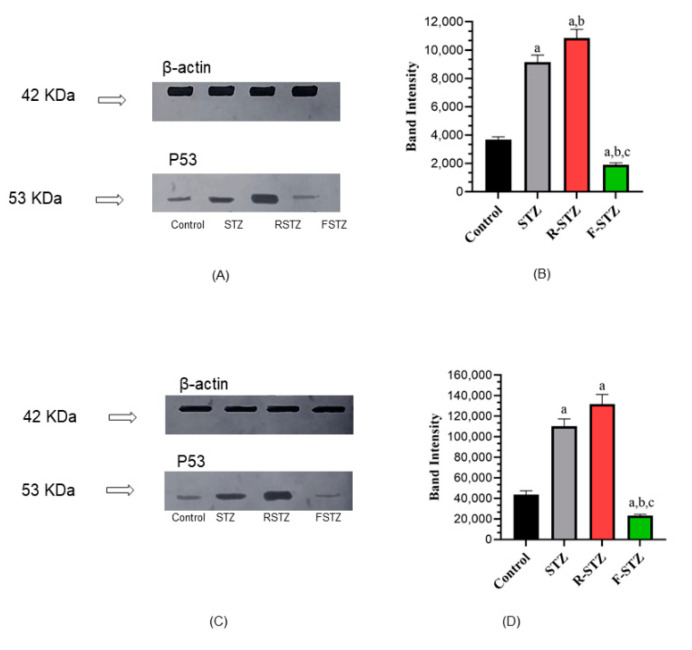
Figure 4.
Cellular apoptosis marker p53 protein level in pancreatic and renal tissue samples of the study groups (A) Pancreatic representative WB; (B) Pancreatic densitometric quantification of WB, bars represent mean ±SD of band intensity (n = 5); (C) Renal representative WB; (D) Renal densitometric quantification of WB, bars represent mean ±SD of band intensity (n = 5). (a) Significant difference from normal control group at p < 0.05; (b) Significant difference from STZ group at p < 0.05; (c) Significant difference from R-STZ group at p < 0.05.

