Figure 1.
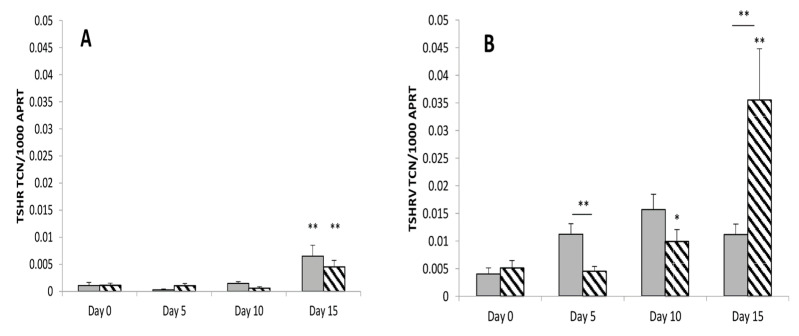
The full length TSHR (A) and the TSHRv (B) transcripts were measured in GO (Stippled bar, n = 5) and non-GO OF (Grey bar, n = 5) at multiple time points before (Day 0) and during adipogenesis (Day 5, 10, 15). Results are expressed as transcript copy number of TSHR or TSHRv per 1000 copies of the housekeeper APRT. Results are expressed as mean ± SEM; * p-value < 0.05, ** < 0.01 compared to day 0 on each respective day. Horizontal bars represent comparison between non-GO and GO.

