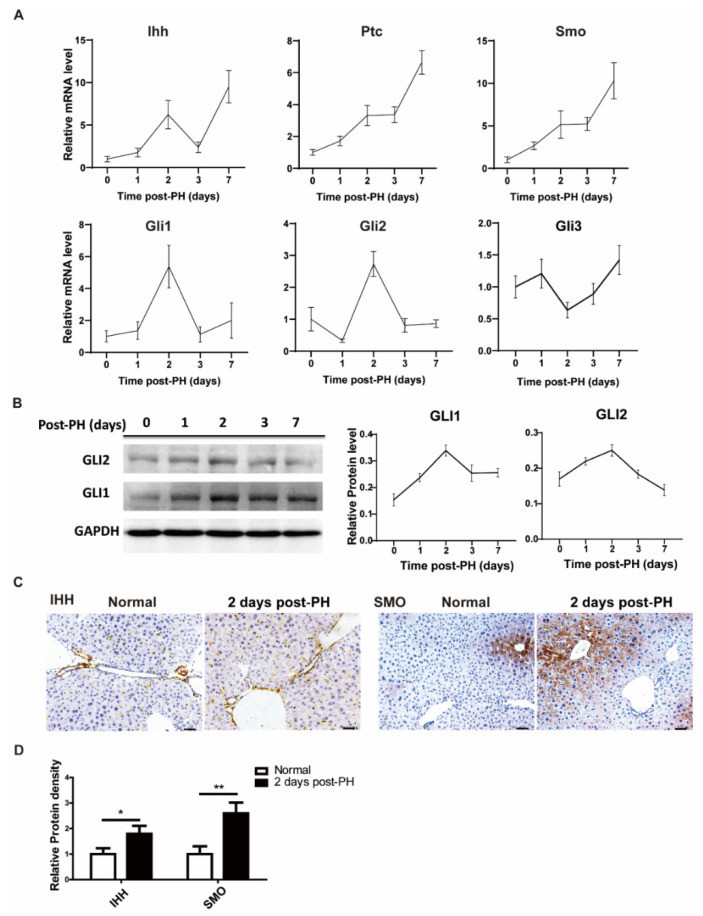
Figure 1.
Hedgehog signal activated after PH. (A) mRNA change trend of Hh signaling pathway (IHH, PTC, SMO, GLI1, GLI2, GLI3) in liver tissue of mice at different time points after PH (0, 1, 2, 3 and 7 days), n = 5. (B) Representative Western blot results of GLI1 and GLI2 in the liver tissues of mice at different time points after PH (0, 1, 2, 3 and 7 days). Western blot quantification analysis compared to GAPDH is shown in the line chart, n = 3. (C) Representative immunohistochemical results of IHH and SMO staining in liver of normal mice and two days after PH, bar means 50 µm. (D) Results of IHH and SMO immunohistochemical quantitative analysis, analyzed with Image J, 5 pictures for each group, n = 3. All data represent means ± SEM. * p < 0.05, ** p < 0.01 vs. control group.

