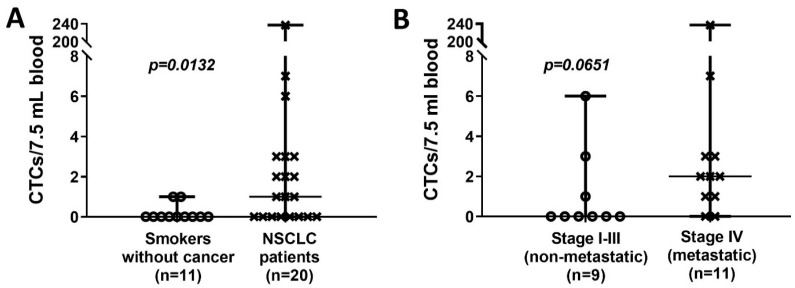
Figure 2.
CTC counts in the study populations. (A). CTC counts in high-risk controls (long-term smokers) without cancer and patients diagnosed with NSCLC. (B). Distribution of CTC count for NSCLC patients by tumor stages, separating them in localized/loco-regional stage I–III versus advanced, metastatic stage IV. (Scatter dot plots; p values were calculated with Mann–Whitney test).

