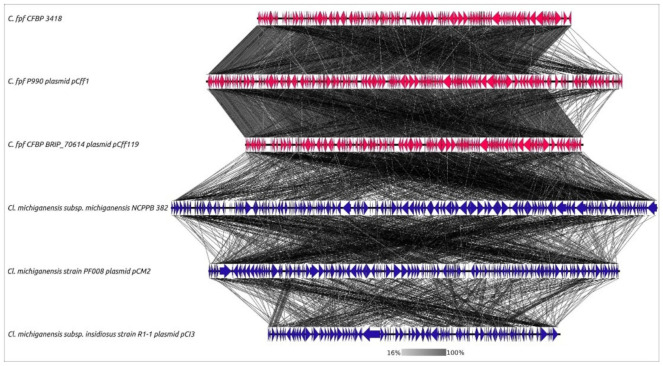
Figure 7.
Genome sequence comparison among six Curtobacterium and Clavibacter plasmids and chromosome regions exhibiting co-linearity as detected by TBLASTX. The percentage of the sequence similarity is indicated by the intensity of the grey colour. Vertical blocks between analysed sequences indicate regions with at least 16% similarity. The abbreviations are as follows: C.—Curtobacterium, Cl.—Clavibacter, and C. fpf—flaccumfaciens pv. flaccumfaciens.

