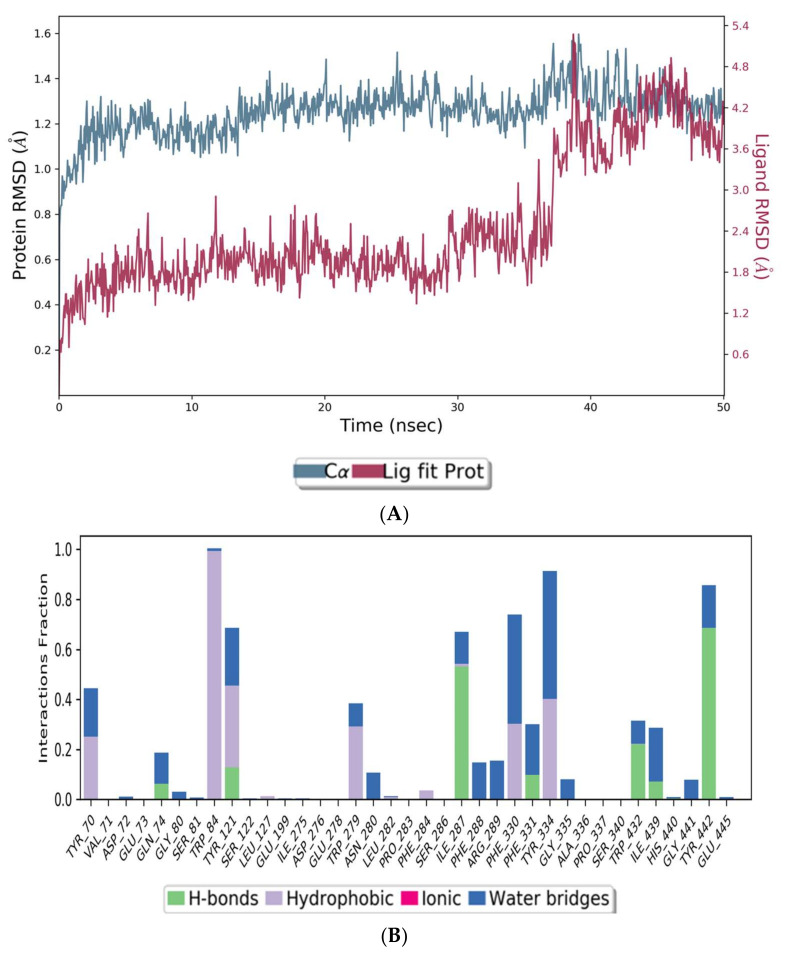
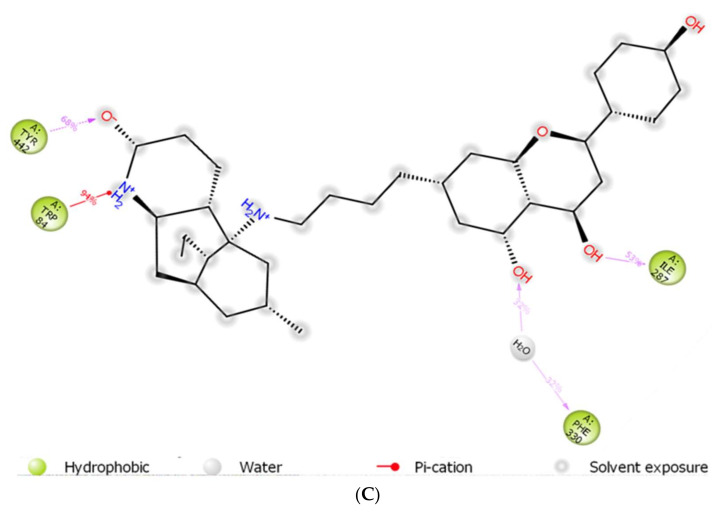
Figure 4.
MD simulation studies of huperzine-4C-naranginin in complex with AChE. (A) RMSD plot of protein backbone (Cα) and protein conformational change during ligand binding. (B) Interaction fraction plot showing different protein residues that interact with the ligand during a 50 ns MD simulation. (C) Interaction of ligand atoms with the protein residues that occur for more than 30% of the simulation time.


