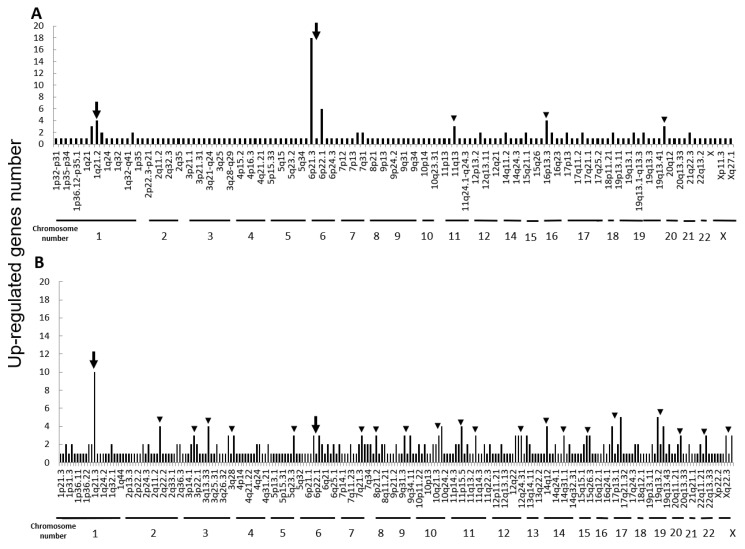
Figure 2.
Chromosomal location of up-regulated genes in IR cells from microarray data. Up-regulated gene numbers are displayed on the vertical axis and genome locations from chromosome 1 to chromosome X are plotted along the horizontal axis. (A) The human non-small cell lung cancer cell line H1299. (B) The human breast cancer cell line MCF7. The arrowheads represent chromosomal locations where three or more differentially expressed genes are present, and the arrow represents the loci that are common to both H1299-IR and MCF7-IR cells.

