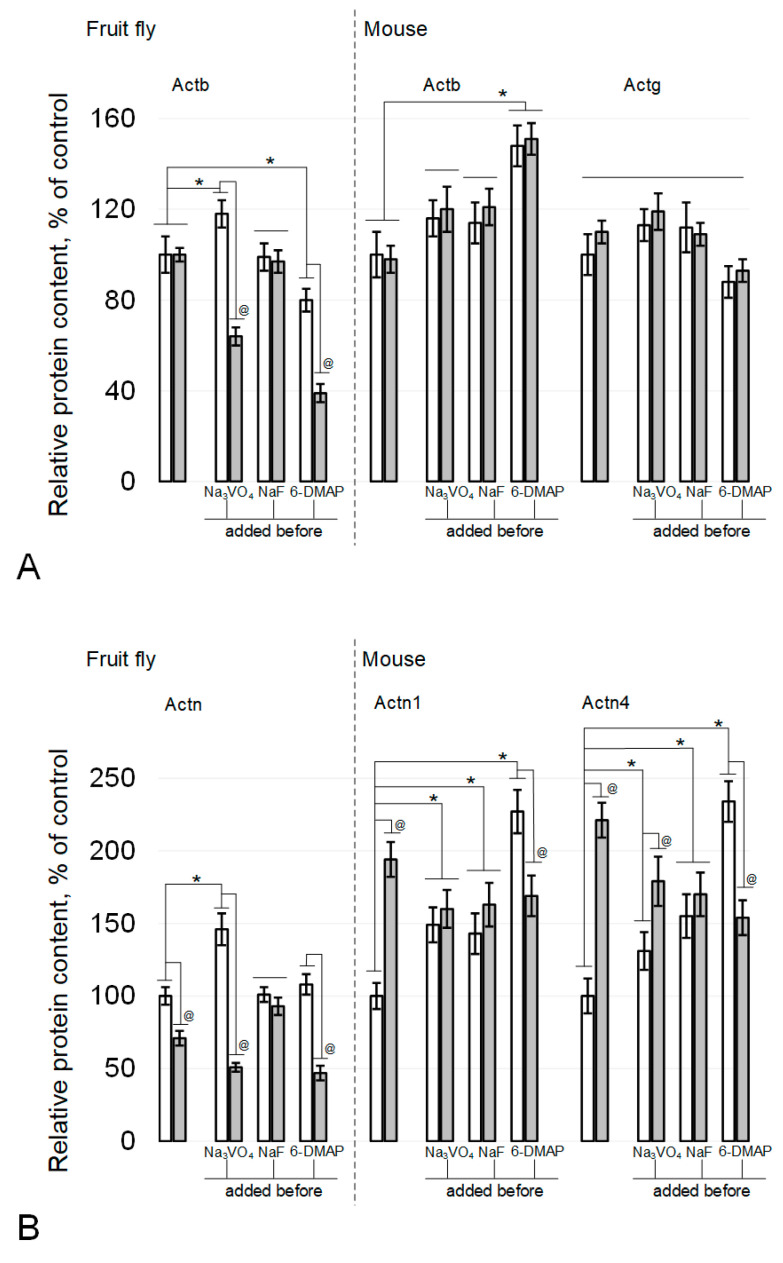
Figure 4.
Actin and alpha-actinin isoforms relative content in the fly and mouse sperm. (A) actin isoforms, beta-actin Actb and gamma-actin Actg. (B) alpha-actinin isoforms, alpha-actinin Actn (Drosophila melanogaster), alpha-actinin1 Actn1 (mouse) and alpha-actinin4 Actn4 (mouse). White columns—control, grey columns—after 6 h exposure under modelling microgravity conditions. @ p < 0.05 in comparison with according control group, * p < 0.05 in comparison with control without any inhibitors.

