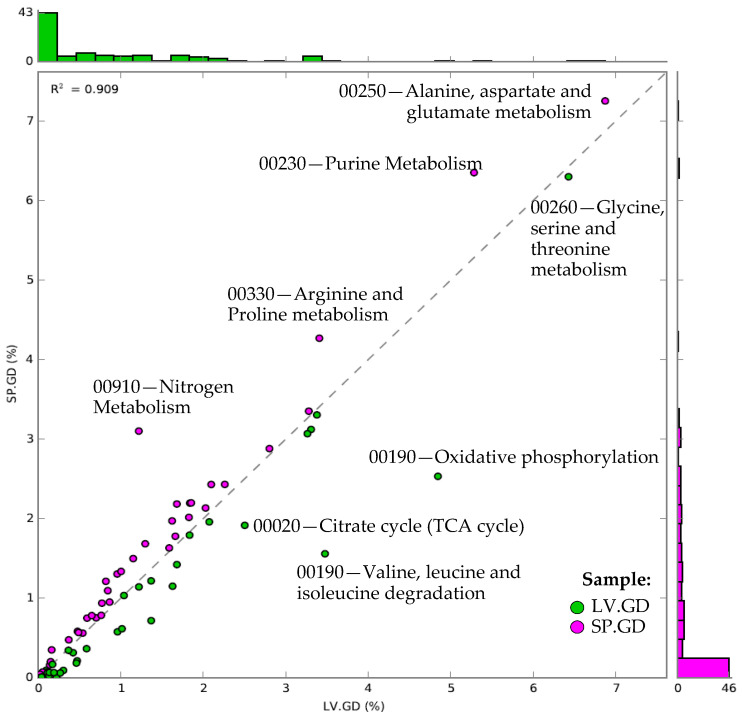
Figure 4.
Relative abundance scatter plot analysis of the KEGG map Ids derived from the KEGG-Level-1 category of “metabolism”. KEGG map Id data was retrieved from the KEGG-Level-3 functional categories from MG-RAST (v4.0.3) and was uploaded into STAMP (v2.1.3). Technical replicates were grouped, and count data were normalized as the relative proportion of each KEGG map Id per group from the KEGG-Level-1 category of metabolism. The X-axis and Y-axis show each KEGG map Id relative abundance per group, including the histograms to show the number of functional entries falling at the specified abundance on the scatter plot. Those KEGG map Ids that were noticeably enriched in one group were indicated by their KEGG pathway name and Id number. The regression statistic (R2) was also shown in the plot. Sample groups and color codes are indicated as LV.GD = green sea urchin Lytechinus variegatus gut digesta (green); SP.GD = purple sea urchin Strongylocentrotus purpuratus gut digesta (purple).

