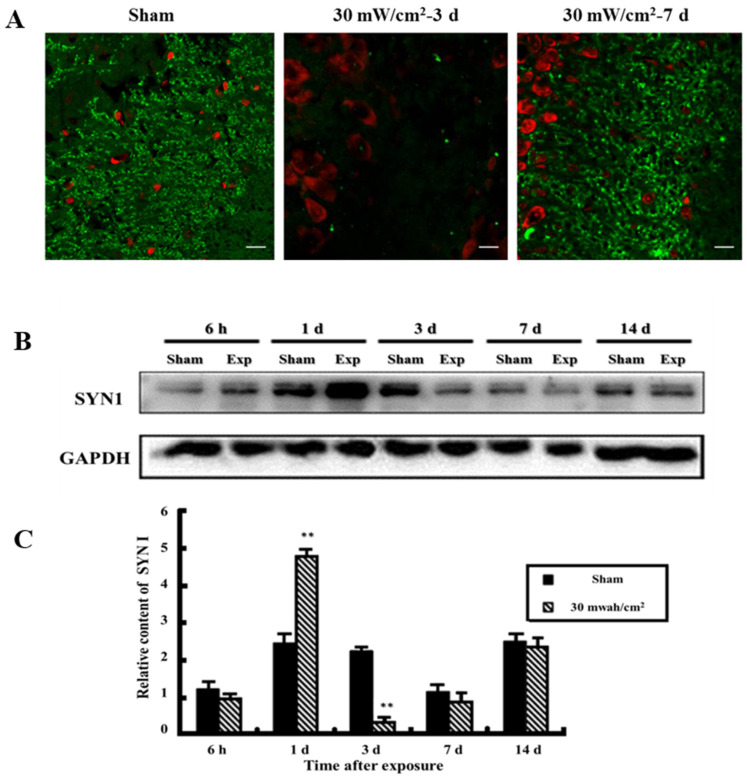
Figure 2.
Expression of SYN1 in rat hippocampus. (A) In situ expression of SYN1 in hippocampus (scale bar = 50 μm); (B) Expression of SYN1 in hippocampus detected by western blot; (C) Quantitative analysis of western blot. (** p < 0.01 vs. sham group) Gels cropped from different parts of the same gel.

