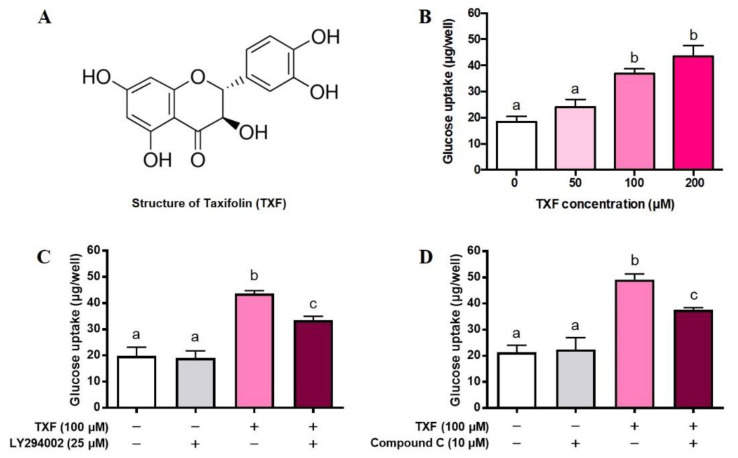
Figure 1.
Structure of taxifolin (A), dose-dependent effect of taxifolin (B), effects of LY294002 (C), and Compound C (D) on glucose uptake in cultured L6 myotubes for 4 h. Each value represents the mean ± SEM for 6 wells of a 24-multiwell plate. Values not sharing a common letter are significantly different at p < 0.05 by Tukey–Kramer multiple comparisons test.

