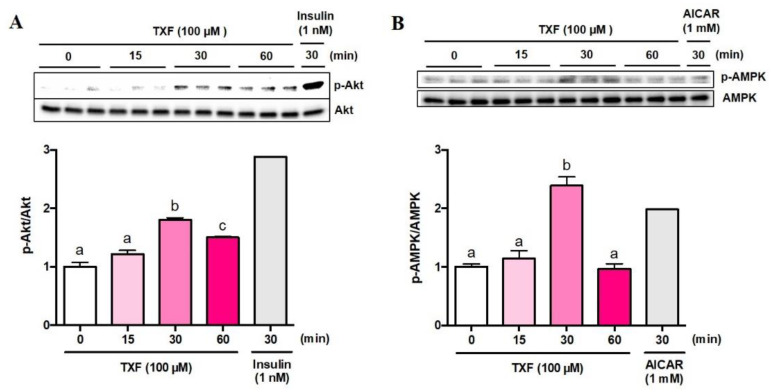
Figure 2.
Time-dependent changes in phosphorylation of Akt (A) and AMPK (B) by TXF (100 µM) in L6 myotubes. Each value represents the mean ± SEM for 3 dishes (60 mm in diameter). Insulin (n = 1) and AICAR (n = 1) were used as positive controls for Akt and AMPK pathways, respectively, and excluded from statistical analyses. Values not sharing a common letter were significantly different at p < 0.05 by the Tukey–Kramer multiple comparison test.

