
Figure 5.
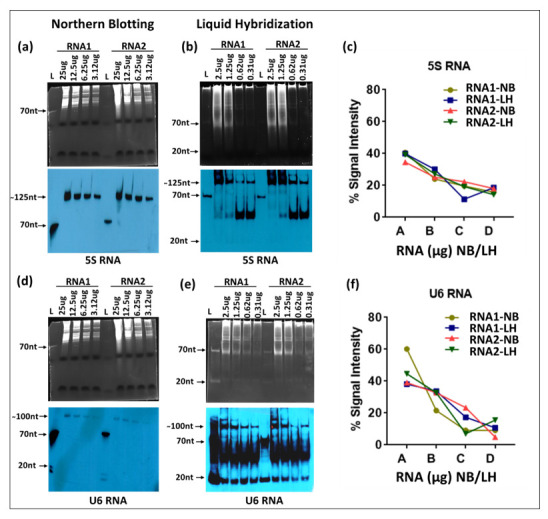
Liquid hybridization (LH) shows a similar trend for small RNA expression but with higher sensitivity and background when compared to northern blot (NB) analysis. For northern blotting, serial dilutions of TRIzol-extracted RNA (25, 12.5, 6.25 and 3.125 μg each) were loaded on 15% urea-acrylamide gels followed by semi-dry transfer to a nylon membrane and hybridization with biotinylated single-stranded oligonucleotide probes (50 pmol/mL). Whereas for liquid hybridization, serial dilutions of RNA (2.5, 1.25, 0.625 and 0.3125 μg each) were subjected to hybridization with biotinylated probe (10 pmol/reaction) followed by Exo-I treatment. After hybridization, the RNA/probe mixtures were loaded on 15% non-denaturing acrylamide-TBE gels followed by transfer onto nylon membranes using semi-dry blotting. Gels were stained with ethidium bromide for visualization under UVP, followed by semi-dry transfer onto nylon membrane. These were subjected to UV crosslinking and incubation with HRP-conjugated streptavidin before detection with X-ray film. (a) Gel image of extracted RNA from cell lines loaded in serial dilutions before transfer to a nylon membrane. After transfer, the membrane was probed with biotinylated 5S RNA small RNA, and expression was detected using X-ray film. (b) Gel image of the hybridized mixture of RNA with 5S RNA-biotinylated probe before transfer followed by detection using a UVP imaging system. (c) Quantitative analysis of 5S RNA expression levels after northern blot or liquid hybridization techniques. For 5S RNA, the ~125 nt band was used for quantitation purposes. X-axis labels: A = 25 or 2.5 μg; B = 12.5 or 1.25 μg; C = 6.25 or 0.625 μg; D = 3.125 or 0.3125 μg RNA). (d) Gel image of extracted RNA from cell lines loaded in serial dilutions before transfer to the nylon membrane. After transfer, the membrane was probed with biotinylated U6 small RNA probe and HRP-labelled streptavidin, and expression was detected using X-ray film. (e) Gel image of a hybridized mixture of RNA and U6 biotinylated probe before transfer. U6 expression was detected using X-ray film. (f) Quantitative analysis of U6 expression levels after northern or liquid hybridization techniques. X-axis labels: A = 25 or 2.5 μg; B = 12.5 or 1.25 μg; C = 6.25 or 0.625 μg; D = 3.125 or 0.3125 μg RNA). Image quantification was performed using GelQuant.NET software. Relative % intensities were measured for each mRNA and plotted against the corresponding amount of RNA.