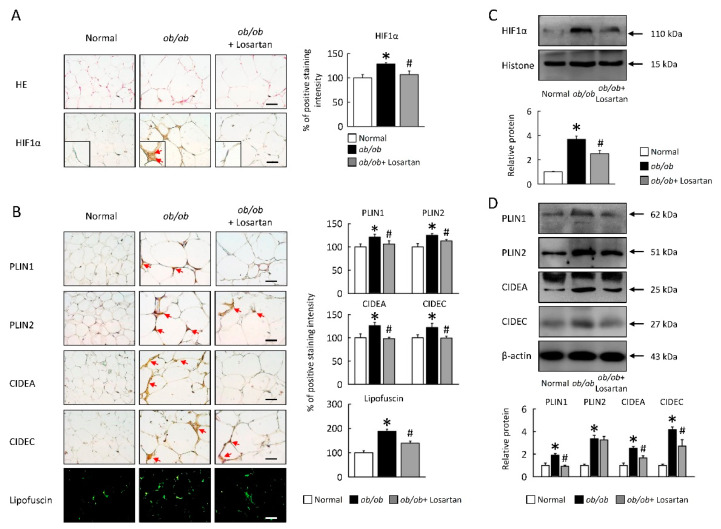
Figure 3.
Losartan attenuated HIF1α expression and LDs formation in EWAT. (A) Representative HE and HIF1α staining. Red arrow highlights the positive staining. Scale bar: 100 μm. Tissue staining, as quantified by either stain intensity, is represented on the left-hand vertical axis in each graph. (B) Representative PLIN1, PLIN2, CIDEA, and CIDEC staining of EWAT. Green pseudocolor represents visualization of lipofuscin’s autofluorescence at 450–490 nm. Red arrow highlights the positive staining. Scale bar: 100 μm. Tissue staining, as quantified by either stain intensity, is represented on the left-hand vertical axis in each graph. Quantification of (C) HIF1α protein levels by Western blot. Below graph indicate quantification relative to Histone. Quantification of (D) PLIN1, PLIN2, CIDEA, and CIDEC protein levels by Western blot of EWAT. Below graphs indicate quantification relative to β-actin. For each animal group, n = 5. All values represent the mean ± SEM. Data were analyzed by Student’s t test. * p ≤ 0.05, normal vs. ob/ob; # p ≤ 0.05, ob/ob vs. ob/ob+ Losartan. HIF1α: hypoxia-inducible factor 1α; LDs: lipid droplets; EWAT: epididymal white adipose tissue; HE: hematoxylin and eosin stain; PLIN1: perilipin 1; CIDEA: cell death inducing DFFA like effector A.

