Figure 3.
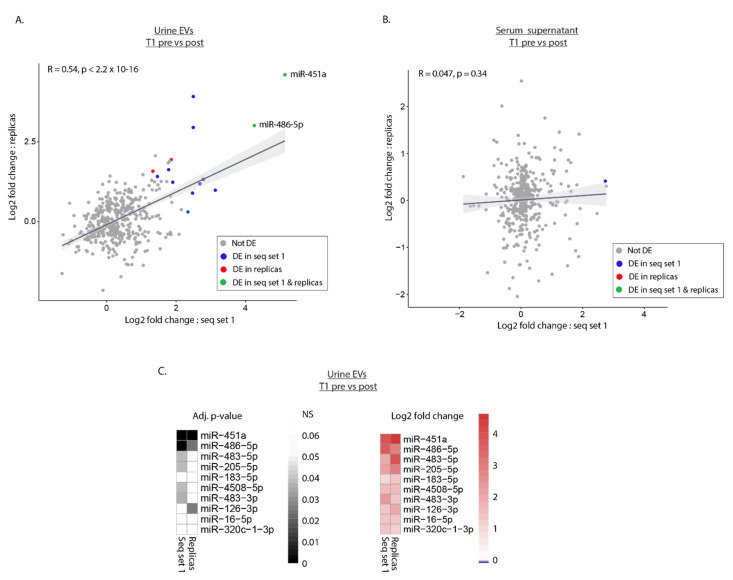
Reproducibility of sequencing data for T1 patients. (A,B) Dot plot showing by log2 fold change for miRNAs in urine EVs (A) and serum supernatant (B) in T1 presurgery (pre) versus postsurgery (post) samples. Samples from ten T1 patients from sequencing (seq) set 1 are compared to replicas from the same patients. Each dot represents an individual miRNA detected in both runs. Dot colors indicate whether miRNAs are DE in seq set 1, replicas, or in both. (C) Heat maps showing adjusted p-values and log2 fold change values for the top ten DEmiRNAs in urine EVs in T1 pre- versus postsurgery samples from seq set 1. An adjusted p-value threshold of 0.05 was set to determine DEmiRNAs for all analyses and non-significance (NS) is denoted in the scale.

