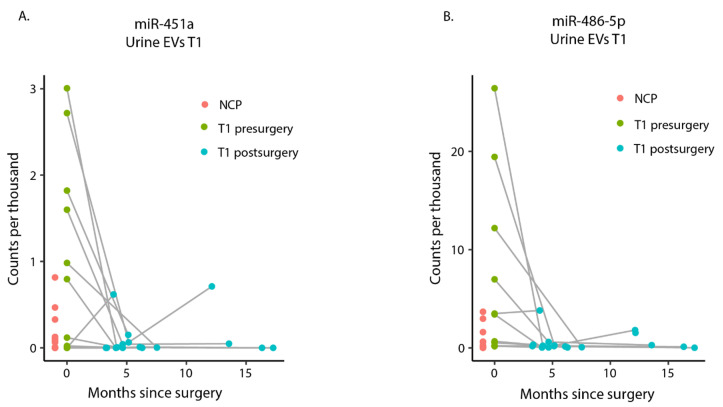
Figure 4.
Expression levels of miR-451a and miR-486-5p in presurgery and postsurgery samples. (A) Line plot showing miR-451a expression in counts per thousands (CPT). Each line follows one T1 patient from presurgery cancer sample (green) to early and late postsurgery samples (blue). (B) Same observation as highlighted in (A) for miR-486-5p.

