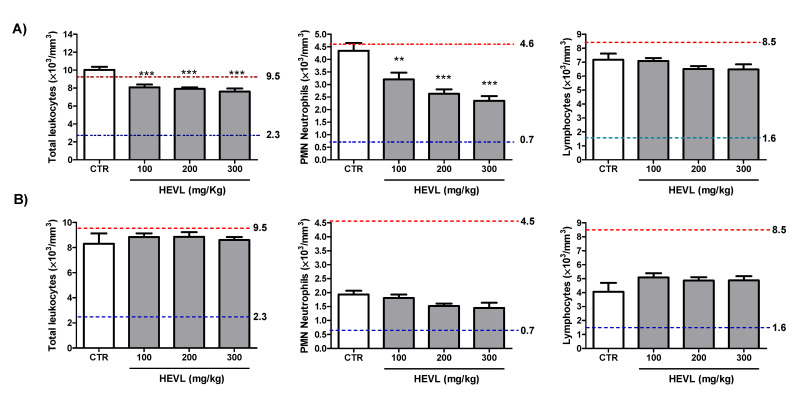
Figure 1.
Assessment of leukocyte counts on the peripheral blood of the animals of the experimental groups on day 7 (A) and on day 14 (B). Red and blue pointed lines represent the upper and lower limits of the reference values. Data are expressed as mean ± standard error mean. Significant differences in comparison with CTR are expressed as ** p < 0.01 and *** p < 0.001(ANOVA and Tukey’s multiple comparison test).

